<?xml version="1.0" encoding="utf-8"?><feed xmlns="http://www.w3.org/2005/Atom" ><generator uri="https://jekyllrb.com/" version="3.10.0">Jekyll</generator><link href="https://stefanpate.github.io/feed.xml" rel="self" type="application/atom+xml" /><link href="https://stefanpate.github.io/" rel="alternate" type="text/html" /><updated>2026-07-01T12:20:53+00:00</updated><id>https://stefanpate.github.io/feed.xml</id><title type="html">StefaNN</title><subtitle>Stefan Pate&apos;s personal website and blog.</subtitle><entry><title type="html">Patchwork Quilt, U.S.A.: a future within biking distance</title><link href="https://stefanpate.github.io/blog/opinion/sustainability/bike/2026/05/17/within-biking-distance.html" rel="alternate" type="text/html" title="Patchwork Quilt, U.S.A.: a future within biking distance" /><published>2026-05-17T15:00:00+00:00</published><updated>2026-05-17T15:00:00+00:00</updated><id>https://stefanpate.github.io/blog/opinion/sustainability/bike/2026/05/17/within-biking-distance</id><content type="html" xml:base="https://stefanpate.github.io/blog/opinion/sustainability/bike/2026/05/17/within-biking-distance.html"><![CDATA[<h3 id="saturdays-henceforth-are-declared-car-free"><strong>Saturdays, henceforth, are declared car-free</strong></h3>
<p>Imagine your government has declared that beginning next weekend, no passenger vehicle may be operated from midnight to midnight on Saturdays. Their intention is to save gasoline in the face of shortages resulting from the weeks-long closure of the Strait of Hormuz. If it was your government that caused the closure, you may be tempted to laugh sarcastically or rage. Stick with me. Imagine car-free Saturday has been given by order of the Peaky Blinders if it helps. Say it in Arthur’s voice to channel your rage.
Your government (or the Shelby Company Limited) has committed to a stimulus package similar in magnitude to the American CARES Act.<sup id="fnref:1" role="doc-noteref"><a href="#fn:1" class="footnote" rel="footnote">1</a></sup> Eligible adults may select any bicycle from <a href="https://www.bilka.dk/fritid/cykler/c/cykler/">this catalogue</a> including accessories like milk crates, baskets, or saddle bags, and credits are available for dependents that can be applied to children’s bikes and cargo bikes for families. Logistics companies have been contracted to deliver these items to your home.</p>

<p>Now the question is: what can you get up to? To help you plan your first car-free Saturday, there is a map widget below. You can enter your home address or double click on any point on the map. It will show you the area accessible within 20 minutes’ ride of that location. You may vary how long you are willing to ride. On the right-hand side you can toggle on different categories of destinations. (The colored dots are not comprehensive so don’t be surprised if you see additional points of interest on the map without a dot.) Remember, there are no cars whizzing by. You can ride any of the roads and be assured that the scariest thing you might see is Tommy Shelby on a black horse.</p>

<p>Have a look, make a mental note of what you learn, take a screen shot if you are willing. Feel free to inspect other locations, perhaps where you grew up. One final detail, I’m giving a rough estimate of walking and driving times to put the size of the bikeable region into context for those of you who don’t cycle often. Ok see you again on the flip side!</p>

<style>
	.map-widget {
		display: flex;
		flex-direction: column;
		gap: 12px;
		margin: 16px 0;
		font: 14px/1.4 -apple-system, BlinkMacSystemFont, "Segoe UI", Arial, sans-serif;
	}

	@media (min-width: 900px) {
		.map-widget { margin-right: -212px; }
	}

	.map-widget__controls {
		display: flex;
		flex-wrap: wrap;
		gap: 12px 16px;
		align-items: center;
		padding: 12px;
		background: #f7f7f7;
		border: 1px solid #e2e2e2;
		border-radius: 6px;
	}

	.map-widget__controls label {
		display: inline-flex;
		align-items: center;
		gap: 6px;
	}

	.map-widget__address-wrap {
		position: relative;
		flex: 1 1 220px;
		min-width: 180px;
	}

	.map-widget__address {
		width: 100%;
		box-sizing: border-box;
		padding: 6px 10px;
		border: 1px solid #ccc;
		border-radius: 4px;
		font-size: 14px;
	}

	.map-widget__suggestions {
		position: absolute;
		top: 100%;
		left: 0;
		right: 0;
		background: #fff;
		border: 1px solid #ccc;
		border-top: 0;
		border-radius: 0 0 4px 4px;
		max-height: 240px;
		overflow-y: auto;
		z-index: 5;
		margin: 0;
		padding: 0;
		list-style: none;
		box-shadow: 0 4px 10px rgba(0,0,0,0.08);
	}

	.map-widget__suggestions li {
		padding: 6px 10px;
		cursor: pointer;
		font-size: 14px;
	}

	.map-widget__suggestions li:hover,
	.map-widget__suggestions li[aria-selected="true"] {
		background: #eef3ff;
	}

	.map-widget__suggestions--hidden { display: none; }

	.map-widget__cat-dot {
		display: inline-block;
		width: 10px;
		height: 10px;
		border-radius: 50%;
		border: 1px solid rgba(0,0,0,0.15);
		margin-right: 2px;
		vertical-align: middle;
	}

	.map-widget__submit {
		padding: 6px 14px;
		background: #1f6feb;
		color: #fff;
		border: 0;
		border-radius: 4px;
		cursor: pointer;
		font-size: 14px;
	}

	.map-widget__submit:hover { background: #1558c4; }

	.map-widget__time { width: 160px; }

	.map-widget__body {
		display: flex;
		gap: 12px;
		align-items: stretch;
	}

	.map-widget__map {
		flex: 1 1 auto;
		min-width: 0;
		height: 60vh;
		min-height: 360px;
		border-radius: 6px;
		overflow: hidden;
	}

	.map-widget__categories {
		flex: 0 0 200px;
		display: flex;
		flex-direction: column;
		gap: 6px;
		border: 1px solid #e2e2e2;
		background: #f7f7f7;
		border-radius: 6px;
		padding: 10px 12px;
		margin: 0;
		max-height: 60vh;
		overflow-y: auto;
	}

	.map-widget__categories legend {
		font-weight: 600;
		font-size: 13px;
		padding: 0 0 4px 0;
	}

	@media (max-width: 640px) {
		.map-widget__body { flex-direction: column; }
		.map-widget__categories { flex: 0 0 auto; max-height: none; }
	}

	.map-widget__status {
		min-height: 18px;
		font-size: 13px;
		color: #555;
	}

	.map-widget__status--error { color: #b3261e; }

	.map-widget--missing-token {
		display: flex;
		align-items: center;
		justify-content: center;
		background: #f2f2f2;
		color: #444;
		padding: 24px;
		text-align: center;
		border-radius: 6px;
		min-height: 120px;
	}

	.map-widget__poi-popup { font-size: 13px; }
	.map-widget__poi-popup strong { display: block; margin-bottom: 2px; }

	.map-widget__metrics {
		display: flex;
		flex-wrap: wrap;
		gap: 8px;
	}

	.map-widget__metrics--hidden { display: none; }

	.map-widget__metric {
		flex: 1 1 180px;
		padding: 8px 12px;
		background: #f7f7f7;
		border: 1px solid #e2e2e2;
		border-radius: 6px;
		font-size: 13px;
		display: flex;
		align-items: baseline;
		justify-content: space-between;
		gap: 8px;
	}

	.map-widget__metric-label { color: #555; }
	.map-widget__metric-value { font-weight: 600; font-size: 14px; }
	.map-widget__metric-value--pending { color: #888; font-weight: 400; }
	.map-widget__metric-value--positive { color: #b3261e; }
	.map-widget__metric-value--negative { color: #2f9e44; }

	.map-widget__parking {
		display: flex;
		align-items: center;
		gap: 6px;
		font-size: 12px;
		color: #666;
		padding: 0 4px;
	}

	.map-widget__parking input[type="range"] { width: 100px; }
</style>
<div class="map-widget" data-initial-lat="41.88" data-initial-lng="-87.65" data-initial-zoom="12" data-initial-time="20">
	<form class="map-widget__controls" onsubmit="return false;">
		<div class="map-widget__address-wrap">
			<input type="text" class="map-widget__address" placeholder="Enter an address (e.g. 1600 Pennsylvania Ave, Washington, DC)" aria-label="Address" autocomplete="off" />
			<ul class="map-widget__suggestions map-widget__suggestions--hidden" role="listbox"></ul>
		</div>
		<button type="submit" class="map-widget__submit">Go</button>
		<label>
			One-way travel time:
			<input type="range" class="map-widget__time" min="5" max="45" step="5" value="20" />
			<span class="map-widget__time-readout">20 min</span>
		</label>
	</form>
	<div class="map-widget__parking">
		<label>
			Parking time:
			<input type="range" class="map-widget__parking-slider" min="0" max="20" step="1" value="5" />
			<span class="map-widget__parking-readout">5 min</span>
		</label>
	</div>
	<div class="map-widget__metrics map-widget__metrics--hidden" aria-live="polite">
		<div class="map-widget__metric">
			<span class="map-widget__metric-label">Walking vs cycling</span>
			<span class="map-widget__metric-value map-widget__metric-value--walk">—</span>
		</div>
		<div class="map-widget__metric">
			<span class="map-widget__metric-label">Driving vs cycling</span>
			<span class="map-widget__metric-value map-widget__metric-value--drive">—</span>
		</div>
	</div>
	<div class="map-widget__body">
		<div class="map-widget__map" id="post-map"></div>
		<fieldset class="map-widget__categories">
			<legend>Categories</legend>
			<label><input type="checkbox" value="grocery" checked="" /> Groceries</label>
			<label><input type="checkbox" value="restaurant" checked="" /> Restaurants</label>
			<label><input type="checkbox" value="coffee" checked="" /> Coffee</label>
			<label><input type="checkbox" value="cafe" /> Cafes</label>
			<label><input type="checkbox" value="bakery" /> Bakeries</label>
			<label><input type="checkbox" value="bar" /> Bars</label>
			<label><input type="checkbox" value="farmers_market" /> Farmers markets</label>
			<label><input type="checkbox" value="park" checked="" /> Parks</label>
			<label><input type="checkbox" value="school" /> Schools</label>
			<label><input type="checkbox" value="playground" /> Playgrounds</label>
			<label><input type="checkbox" value="fitness_center" /> Gyms</label>
			<label><input type="checkbox" value="shopping" checked="" /> Shopping</label>
			<label><input type="checkbox" value="pharmacy" /> Pharmacies</label>
			<label><input type="checkbox" value="post_office" /> Post offices</label>
			<label><input type="checkbox" value="hardware_store" /> Hardware stores</label>
			<label><input type="checkbox" value="library" checked="" /> Libraries</label>
			<label><input type="checkbox" value="cinema" checked="" /> Cinemas</label>
			<label><input type="checkbox" value="museum" /> Museums</label>
		</fieldset>
	</div>
	<div class="map-widget__status" role="status" aria-live="polite"></div>
</div>

<link href="https://api.mapbox.com/mapbox-gl-js/v3.8.0/mapbox-gl.css" rel="stylesheet" />

<script src="https://api.mapbox.com/mapbox-gl-js/v3.8.0/mapbox-gl.js"></script>

<script src="https://unpkg.com/@turf/turf@7.1.0/turf.min.js"></script>

<script>
(function () {
	var widget = document.querySelector(".map-widget");
	if (!widget || typeof mapboxgl === "undefined") return;

	var token = "pk.eyJ1Ijoic3RlZmFucGF0ZSIsImEiOiJjbXBhYnNpOTYwNmhlMnFwdHloeTZneDI1In0.OIRcDXmuy4ltw2YOVcxRyg";
	mapboxgl.accessToken = token;

	var initialCenter = [
		parseFloat(widget.dataset.initialLng),
		parseFloat(widget.dataset.initialLat)
	];
	var initialZoom = parseFloat(widget.dataset.initialZoom);
	var initialTime = parseFloat(widget.dataset.initialTime);

	var addressInput = widget.querySelector(".map-widget__address");
	var suggestionsEl = widget.querySelector(".map-widget__suggestions");
	var submitBtn = widget.querySelector(".map-widget__submit");
	var form = widget.querySelector(".map-widget__controls");
	var timeSlider = widget.querySelector(".map-widget__time");
	var timeReadout = widget.querySelector(".map-widget__time-readout");
	var categoryBoxes = Array.prototype.slice.call(
		widget.querySelectorAll(".map-widget__categories input[type='checkbox']")
	);
	var statusEl = widget.querySelector(".map-widget__status");
	var metricsEl = widget.querySelector(".map-widget__metrics");
	var walkValueEl = widget.querySelector(".map-widget__metric-value--walk");
	var driveValueEl = widget.querySelector(".map-widget__metric-value--drive");
	var parkingSlider = widget.querySelector(".map-widget__parking-slider");
	var parkingReadout = widget.querySelector(".map-widget__parking-readout");
	var parkingMinutes = parseFloat(parkingSlider.value);

	parkingSlider.addEventListener("input", function () {
		parkingMinutes = parseFloat(parkingSlider.value);
		parkingReadout.textContent = Math.round(parkingMinutes) + " min";
		var cached = state.boundaryKey ? matrixCache.get(state.boundaryKey) : null;
		if (cached) renderMetrics(cached);
	});

	timeSlider.value = String(initialTime);
	timeReadout.textContent = Math.round(initialTime) + " min";

	var ROUTING_PROFILE = "cycling";

	var CATEGORY_COLORS = {
		coffee: "#8b5a2b",
		restaurant: "#d9480f",
		park: "#2f9e44",
		bar: "#9c36b5",
		grocery: "#1971c2",
		school: "#f08c00",
		fitness_center: "#e03131",
		shopping: "#c2255c",
		pharmacy: "#12b886",
		library: "#5f3dc4",
		bakery: "#c97a2b",
		post_office: "#495057",
		cafe: "#a0522d",
		playground: "#37b24d",
		hardware_store: "#5c940d",
		farmers_market: "#e8590c",
		cinema: "#7048e8",
		museum: "#0b7285"
	};

	categoryBoxes.forEach(function (box) {
		var color = CATEGORY_COLORS[box.value] || "#444";
		var dot = document.createElement("span");
		dot.className = "map-widget__cat-dot";
		dot.style.background = color;
		box.parentNode.insertBefore(dot, box.nextSibling);
	});

	var state = {
		center: initialCenter.slice(),
		timeMinutes: initialTime,
		hasGeocoded: false,
		boundary: null,
		boundaryKey: null
	};

	var isoCache = new Map();

	var cache = new Map();

	var isoRequestSeq = 0;

	var matrixCache = new Map();

	var matrixRequestSeq = 0;

	var sessionToken = (function () {
		if (window.crypto && crypto.randomUUID) return crypto.randomUUID();
		return "s-" + Date.now() + "-" + Math.random().toString(36).slice(2);
	})();

	var suggestions = [];
	var activeSuggestion = -1;
	var suggestSeq = 0;

	function setStatus(msg, isError) {
		statusEl.textContent = msg || "";
		statusEl.classList.toggle("map-widget__status--error", !!isError);
	}

	var map = new mapboxgl.Map({
		container: "post-map",
		style: "mapbox://styles/mapbox/streets-v12",
		center: initialCenter,
		zoom: initialZoom
	});

	map.addControl(new mapboxgl.NavigationControl(), "top-right");

	var centerMarker = null;

	function setCenterMarker(lngLat, label) {
		if (!centerMarker) {
			centerMarker = new mapboxgl.Marker({ color: "#1f6feb" })
				.setLngLat(lngLat)
				.addTo(map);
		} else {
			centerMarker.setLngLat(lngLat);
		}
		if (label) {
			centerMarker.setPopup(
				new mapboxgl.Popup({ offset: 24 }).setHTML(
					'<div class="map-widget__poi-popup"><strong>' + escapeHtml(label) + '</strong></div>'
				)
			);
		}
	}

	map.on("error", function (e) {
		var err = e && e.error;
		var msg = err && err.message ? err.message : "Unknown map error";
		var status = err && err.status ? " [HTTP " + err.status + "]" : "";
		console.error("Mapbox error:", err);
		setStatus("Map error" + status + ": " + msg, true);
	});

	map.on("load", function () {
		map.addSource("circle", { type: "geojson", data: emptyFC() });
		map.addLayer({
			id: "circle-fill",
			type: "fill",
			source: "circle",
			paint: { "fill-color": "#1f6feb", "fill-opacity": 0.12 }
		});
		map.addLayer({
			id: "circle-line",
			type: "line",
			source: "circle",
			paint: { "line-color": "#1f6feb", "line-width": 2 }
		});

		categoryBoxes.forEach(function (box) {
			var cat = box.value;
			map.addSource("pois-" + cat, { type: "geojson", data: emptyFC() });
			map.addLayer({
				id: "pois-" + cat,
				type: "circle",
				source: "pois-" + cat,
				paint: {
					"circle-radius": 6,
					"circle-color": CATEGORY_COLORS[cat] || "#444",
					"circle-stroke-color": "#fff",
					"circle-stroke-width": 1.5
				}
			});

			map.on("click", "pois-" + cat, function (e) {
				var f = e.features && e.features[0];
				if (!f) return;
				new mapboxgl.Popup()
					.setLngLat(f.geometry.coordinates)
					.setHTML(
						'<div class="map-widget__poi-popup">' +
						'<strong>' + escapeHtml(f.properties.name || "(unnamed)") + '</strong>' +
						escapeHtml(f.properties.category || cat) +
						'</div>'
					)
					.addTo(map);
			});
			map.on("mouseenter", "pois-" + cat, function () { map.getCanvas().style.cursor = "pointer"; });
			map.on("mouseleave", "pois-" + cat, function () { map.getCanvas().style.cursor = ""; });
		});
	});

	form.addEventListener("submit", function (e) {
		e.preventDefault();
		var addr = addressInput.value.trim();
		if (!addr) return;
		geocodeAndUpdate(addr);
	});
	submitBtn.addEventListener("click", function (e) {
		e.preventDefault();
		form.dispatchEvent(new Event("submit"));
	});

	var debouncedRefresh = debounce(function () {
		if (!state.hasGeocoded) return;
		redrawIsochrone().then(function () {
			refreshAllPois();
			updateTravelMetrics();
			setStatus("");
		}).catch(function () {});
	}, 300);

	timeSlider.addEventListener("input", function () {
		state.timeMinutes = parseFloat(timeSlider.value);
		timeReadout.textContent = Math.round(state.timeMinutes) + " min";
		debouncedRefresh();
	});

	categoryBoxes.forEach(function (box) {
		box.addEventListener("change", function () {
			var cat = box.value;
			if (box.checked) {
				if (state.hasGeocoded) fetchCategory(cat);
			} else {
				var src = map.getSource("pois-" + cat);
				if (src) src.setData(emptyFC());
			}
		});
	});

	function applyResolvedLocation(lngLat, label) {
		state.center = lngLat;
		state.hasGeocoded = true;
		setCenterMarker(state.center, label);
		map.flyTo({ center: state.center, zoom: Math.max(map.getZoom(), 13) });
		return redrawIsochrone().then(function () {
			refreshAllPois();
			updateTravelMetrics();
			setStatus(label ? "Showing results near " + label : "");
		}).catch(function () {});
	}

	function hideSuggestions() {
		suggestionsEl.classList.add("map-widget__suggestions--hidden");
		suggestionsEl.innerHTML = "";
		suggestions = [];
		activeSuggestion = -1;
	}

	function renderSuggestions() {
		suggestionsEl.innerHTML = "";
		if (!suggestions.length) {
			hideSuggestions();
			return;
		}
		suggestions.forEach(function (s, i) {
			var li = document.createElement("li");
			li.setAttribute("role", "option");
			li.setAttribute("data-index", String(i));
			var primary = s.name || s.place_formatted || "";
			var secondary = s.place_formatted && s.place_formatted !== primary ? s.place_formatted : "";
			li.innerHTML = '<strong>' + escapeHtml(primary) + '</strong>' +
				(secondary ? '<div style="color:#666;font-size:12px;">' + escapeHtml(secondary) + '</div>' : '');
			if (i === activeSuggestion) li.setAttribute("aria-selected", "true");
			li.addEventListener("mousedown", function (ev) {
				ev.preventDefault();
				selectSuggestion(i);
			});
			suggestionsEl.appendChild(li);
		});
		suggestionsEl.classList.remove("map-widget__suggestions--hidden");
	}

	function fetchSuggestions(q) {
		var mySeq = ++suggestSeq;
		var url = "https://api.mapbox.com/search/searchbox/v1/suggest" +
			"?q=" + encodeURIComponent(q) +
			"&limit=5" +
			"&session_token=" + encodeURIComponent(sessionToken) +
			"&proximity=" + state.center[0] + "," + state.center[1] +
			"&access_token=" + encodeURIComponent(token);
		fetch(url)
			.then(function (r) { return r.ok ? r.json() : null; })
			.then(function (data) {
				if (mySeq !== suggestSeq || !data) return;
				suggestions = data.suggestions || [];
				activeSuggestion = -1;
				renderSuggestions();
			})
			.catch(function (err) { console.error("Suggest failed:", err); });
	}

	var debouncedSuggest = debounce(function (q) { fetchSuggestions(q); }, 200);

	function selectSuggestion(i) {
		var s = suggestions[i];
		if (!s) return;
		var label = s.place_formatted || s.name || "";
		addressInput.value = label;
		hideSuggestions();
		setStatus("Finding address…");
		var url = "https://api.mapbox.com/search/searchbox/v1/retrieve/" +
			encodeURIComponent(s.mapbox_id) +
			"?session_token=" + encodeURIComponent(sessionToken) +
			"&access_token=" + encodeURIComponent(token);
		fetch(url)
			.then(function (r) {
				if (!r.ok) {
					return r.text().then(function (body) {
						throw new Error("HTTP " + r.status + " – " + body.slice(0, 200));
					});
				}
				return r.json();
			})
			.then(function (data) {
				var f = data && data.features && data.features[0];
				if (!f || !f.geometry) {
					setStatus("Could not retrieve that address.", true);
					return;
				}
				var resolvedLabel = (f.properties && (f.properties.full_address || f.properties.place_formatted || f.properties.name)) || label;
				applyResolvedLocation(f.geometry.coordinates, resolvedLabel);
			})
			.catch(function (err) {
				console.error("Retrieve failed:", err);
				setStatus("Address lookup failed: " + err.message, true);
			});
	}

	addressInput.addEventListener("input", function () {
		var q = addressInput.value.trim();
		if (q.length < 2) { hideSuggestions(); return; }
		debouncedSuggest(q);
	});

	addressInput.addEventListener("keydown", function (e) {
		var visible = !suggestionsEl.classList.contains("map-widget__suggestions--hidden");
		if (e.key === "ArrowDown" && visible && suggestions.length) {
			e.preventDefault();
			activeSuggestion = (activeSuggestion + 1) % suggestions.length;
			renderSuggestions();
		} else if (e.key === "ArrowUp" && visible && suggestions.length) {
			e.preventDefault();
			activeSuggestion = (activeSuggestion - 1 + suggestions.length) % suggestions.length;
			renderSuggestions();
		} else if (e.key === "Enter") {
			if (visible && activeSuggestion >= 0) {
				e.preventDefault();
				selectSuggestion(activeSuggestion);
			}
		} else if (e.key === "Escape") {
			hideSuggestions();
		}
	});

	addressInput.addEventListener("blur", function () {
		setTimeout(hideSuggestions, 150);
	});

	function reverseGeocodeAndPlace(lngLat) {
		setStatus("Looking up location…");
		var url = "https://api.mapbox.com/geocoding/v5/mapbox.places/" +
			lngLat[0] + "," + lngLat[1] +
			".json?limit=1&access_token=" + encodeURIComponent(token);
		fetch(url)
			.then(function (r) { return r.ok ? r.json() : null; })
			.then(function (data) {
				var label;
				if (data && data.features && data.features[0]) {
					label = data.features[0].place_name;
				} else {
					label = lngLat[0].toFixed(5) + ", " + lngLat[1].toFixed(5);
				}
				addressInput.value = label;
				applyResolvedLocation(lngLat, label);
			})
			.catch(function (err) {
				console.error("Reverse geocode failed:", err);
				var label = lngLat[0].toFixed(5) + ", " + lngLat[1].toFixed(5);
				addressInput.value = label;
				applyResolvedLocation(lngLat, label);
			});
	}

	map.doubleClickZoom.disable();
	map.on("dblclick", function (e) {
		e.preventDefault();
		var poiLayerIds = categoryBoxes.map(function (b) { return "pois-" + b.value; })
			.filter(function (id) { return !!map.getLayer(id); });
		if (poiLayerIds.length) {
			var hits = map.queryRenderedFeatures(e.point, { layers: poiLayerIds });
			if (hits && hits.length) return;
		}
		reverseGeocodeAndPlace([e.lngLat.lng, e.lngLat.lat]);
	});

	function geocodeAndUpdate(addr) {
		setStatus("Finding address…");
		var url =
			"https://api.mapbox.com/geocoding/v5/mapbox.places/" +
			encodeURIComponent(addr) +
			".json?limit=1&access_token=" +
			encodeURIComponent(token);
		fetch(url)
			.then(function (r) {
				if (!r.ok) {
					return r.text().then(function (body) {
						throw new Error("HTTP " + r.status + " " + r.statusText + " – " + body.slice(0, 200));
					});
				}
				return r.json();
			})
			.then(function (data) {
				if (!data.features || !data.features.length) {
					setStatus("No match for that address.", true);
					return;
				}
				var f = data.features[0];
				applyResolvedLocation(f.center, f.place_name || addr);
			})
			.catch(function (err) {
				console.error("Geocoding failed:", err);
				setStatus("Geocoding failed: " + err.message, true);
			});
	}

	function redrawIsochrone() {
		var centerKey = state.center.map(round5).join(",");
		var timeKey = String(Math.round(state.timeMinutes));
		var key = "iso|" + ROUTING_PROFILE + "|" + centerKey + "|" + timeKey;
		var reqId = ++isoRequestSeq;
		if (isoCache.has(key)) {
			var cached = isoCache.get(key);
			state.boundary = cached;
			state.boundaryKey = key;
			map.getSource("circle").setData(cached);
			return Promise.resolve(cached);
		}
		var minutes = Math.max(1, Math.min(60, Math.round(state.timeMinutes)));
		var params = [
			"contours_minutes=" + minutes,
			"polygons=true",
			"denoise=1",
			"generalize=50",
			"access_token=" + encodeURIComponent(token)
		];
		var url = "https://api.mapbox.com/isochrone/v1/mapbox/" + ROUTING_PROFILE +
			"/" + state.center[0] + "," + state.center[1] + "?" + params.join("&");
		setStatus("Computing reachable area…");
		return fetch(url)
			.then(function (r) {
				if (!r.ok) {
					return r.text().then(function (body) {
						throw new Error("HTTP " + r.status + " " + r.statusText + " – " + body.slice(0, 200));
					});
				}
				return r.json();
			})
			.then(function (data) {
				var fc = (data && data.type === "FeatureCollection") ? data : emptyFC();
				isoCache.set(key, fc);
				if (reqId !== isoRequestSeq) return fc;
				state.boundary = fc;
				state.boundaryKey = key;
				map.getSource("circle").setData(fc);
				return fc;
			})
			.catch(function (err) {
				console.error("Isochrone fetch failed:", err);
				if (reqId === isoRequestSeq) {
					setStatus("Reachable-area fetch failed: " + err.message, true);
				}
				throw err;
			});
	}

	function boundaryPolygon() {
		var fc = state.boundary;
		if (!fc || !fc.features || !fc.features.length) return null;
		return fc.features[0];
	}

	function refreshAllPois() {
		categoryBoxes.forEach(function (box) {
			if (box.checked) fetchCategory(box.value);
		});
	}

	function sampleBoundaryPoints(polyFeature, n) {
		var geom = polyFeature && polyFeature.geometry;
		if (!geom) return [];
		var ring;
		if (geom.type === "Polygon") {
			ring = geom.coordinates[0];
		} else if (geom.type === "MultiPolygon") {
			var best = null;
			geom.coordinates.forEach(function (poly) {
				if (!best || poly[0].length > best.length) best = poly[0];
			});
			ring = best;
		} else {
			return [];
		}
		if (!ring || ring.length < 2) return [];
		var usable = ring.length - 1;
		var count = Math.min(n, usable);
		var step = Math.max(1, Math.floor(usable / count));
		var out = [];
		for (var i = 0; i < usable && out.length < count; i += step) {
			out.push(ring[i]);
		}
		return out;
	}

	function fetchMeanDuration(profile, samples) {
		if (!samples.length) return Promise.resolve(null);
		var coords = [state.center].concat(samples).map(function (c) {
			return round5(c[0]) + "," + round5(c[1]);
		}).join(";");
		var url = "https://api.mapbox.com/directions-matrix/v1/mapbox/" + profile +
			"/" + coords +
			"?sources=0&annotations=duration&access_token=" + encodeURIComponent(token);
		return fetch(url)
			.then(function (r) { return r.ok ? r.json() : null; })
			.then(function (data) {
				if (!data || !data.durations || !data.durations[0]) return null;
				var row = data.durations[0];
				var sum = 0, n = 0;
				for (var i = 1; i < row.length; i++) {
					if (typeof row[i] === "number" && isFinite(row[i])) {
						sum += row[i];
						n++;
					}
				}
				return n ? (sum / n) / 60 : null;
			})
			.catch(function (err) {
				console.error("Matrix (" + profile + ") failed:", err);
				return null;
			});
	}

	function formatWalkPenalty(min) {
		var v = Math.round(min);
		if (v < 0) return "−" + Math.abs(v) + " min";
		if (v > 0) return "+" + v + " min";
		return "~same as cycling";
	}

	function formatDriveDelta(min) {
		var v = Math.round(min);
		if (v < 0) return "−" + Math.abs(v) + " min";
		if (v > 0) return "+" + v + " min";
		return "~same as cycling";
	}

	function setMetricPending() {
		metricsEl.classList.remove("map-widget__metrics--hidden");
		walkValueEl.textContent = "…";
		driveValueEl.textContent = "…";
		walkValueEl.classList.add("map-widget__metric-value--pending");
		driveValueEl.classList.add("map-widget__metric-value--pending");
	}

	function updateTravelMetrics() {
		var polyFeature = boundaryPolygon();
		if (!polyFeature) {
			metricsEl.classList.add("map-widget__metrics--hidden");
			return;
		}
		var key = state.boundaryKey;
		var reqId = ++matrixRequestSeq;
		if (matrixCache.has(key)) {
			renderMetrics(matrixCache.get(key));
			return;
		}
		setMetricPending();
		var samples = sampleBoundaryPoints(polyFeature, 24);
		Promise.all([
			fetchMeanDuration("walking", samples),
			fetchMeanDuration("driving", samples)
		]).then(function (results) {
			if (reqId !== matrixRequestSeq || key !== state.boundaryKey) return;
			var entry = {
				walk: results[0],
				drive: results[1],
				baseMinutes: state.timeMinutes
			};
			matrixCache.set(key, entry);
			renderMetrics(entry);
		});
	}

	function setMetricColor(el, delta) {
		el.classList.remove("map-widget__metric-value--positive", "map-widget__metric-value--negative");
		var v = Math.round(delta);
		if (v > 0) el.classList.add("map-widget__metric-value--positive");
		else if (v < 0) el.classList.add("map-widget__metric-value--negative");
	}

	function renderMetrics(entry) {
		metricsEl.classList.remove("map-widget__metrics--hidden");
		walkValueEl.classList.remove("map-widget__metric-value--pending");
		driveValueEl.classList.remove("map-widget__metric-value--pending");
		if (typeof entry.walk === "number") {
			var walkDelta = entry.walk - entry.baseMinutes;
			walkValueEl.textContent = formatWalkPenalty(walkDelta);
			setMetricColor(walkValueEl, walkDelta);
		} else {
			walkValueEl.textContent = "unavailable";
			walkValueEl.classList.add("map-widget__metric-value--pending");
			setMetricColor(walkValueEl, 0);
		}
		if (typeof entry.drive === "number") {
			var driveDelta = entry.drive + parkingMinutes - entry.baseMinutes;
			driveValueEl.textContent = formatDriveDelta(driveDelta);
			setMetricColor(driveValueEl, driveDelta);
		} else {
			driveValueEl.textContent = "unavailable";
			driveValueEl.classList.add("map-widget__metric-value--pending");
			setMetricColor(driveValueEl, 0);
		}
	}

	function fetchCategory(cat) {
		var polyFeature = boundaryPolygon();
		if (!polyFeature) return;
		var key = cat + "|" + state.boundaryKey;
		if (cache.has(key)) {
			applyPoiData(cat, cache.get(key));
			return;
		}
		var bbox = turf.bbox(polyFeature);
		var url =
			"https://api.mapbox.com/search/searchbox/v1/category/" +
			encodeURIComponent(cat) +
			"?proximity=" + state.center[0] + "," + state.center[1] +
			"&bbox=" + bbox.join(",") +
			"&limit=25" +
			"&access_token=" + encodeURIComponent(token);
		fetch(url)
			.then(function (r) {
				if (!r.ok) {
					return r.text().then(function (body) {
						throw new Error("HTTP " + r.status + " on category " + cat + " – " + body.slice(0, 200));
					});
				}
				return r.json();
			})
			.then(function (data) {
				var features = (data.features || []).filter(function (f) {
					if (!f.geometry || f.geometry.type !== "Point") return false;
					return turf.booleanPointInPolygon(
						turf.point(f.geometry.coordinates),
						polyFeature
					);
				}).map(function (f) {
					return {
						type: "Feature",
						geometry: f.geometry,
						properties: {
							name: f.properties && f.properties.name,
							category: cat
						}
					};
				});
				var fc = { type: "FeatureCollection", features: features };
				cache.set(key, fc);
				applyPoiData(cat, fc);
			})
			.catch(function (err) {
				console.error("POI fetch failed:", err);
				setStatus("POI fetch failed: " + err.message, true);
			});
	}

	function applyPoiData(cat, fc) {
		var src = map.getSource("pois-" + cat);
		if (src) src.setData(fc);
	}

	function emptyFC() {
		return { type: "FeatureCollection", features: [] };
	}

	function debounce(fn, ms) {
		var t = null;
		return function () {
			var args = arguments, self = this;
			clearTimeout(t);
			t = setTimeout(function () { fn.apply(self, args); }, ms);
		};
	}

	function round5(n) { return Math.round(n * 1e5) / 1e5; }

	function escapeHtml(s) {
		return String(s == null ? "" : s)
			.replace(/&/g, "&amp;").replace(/</g, "&lt;").replace(/>/g, "&gt;")
			.replace(/"/g, "&quot;").replace(/'/g, "&#39;");
	}
})();
</script>

<h3 id="the-flip-side"><strong>The flip side</strong></h3>
<p>So, how’d it go? I seriously hope to hear your thoughts. Given the size of my readership, there is a good chance you know how to reach me. If you got lost and wound up here on your own, my email address is at the bottom of this page.</p>

<p>If, like me, you are one of the 80% of Americans living in urban areas<sup id="fnref:2" role="doc-noteref"><a href="#fn:2" class="footnote" rel="footnote">2</a></sup>, I’d bet you were pleasantly surprised by how many points of interest are accessible by bike, at least on car-free Saturdays. Astonishingly, nearly half of all trips Americans make by car are less than 3 miles long, in other words, a breezy 20-minute bike ride.<sup id="fnref:3" role="doc-noteref"><a href="#fn:3" class="footnote" rel="footnote">3</a></sup> American cities are notoriously sprawling and car-centric, but it is the car-centrism, not the sprawl, which prevents us from popping around town on our bicycles.</p>

<h3 id="marco-polo"><strong>Marco! Polo!</strong></h3>
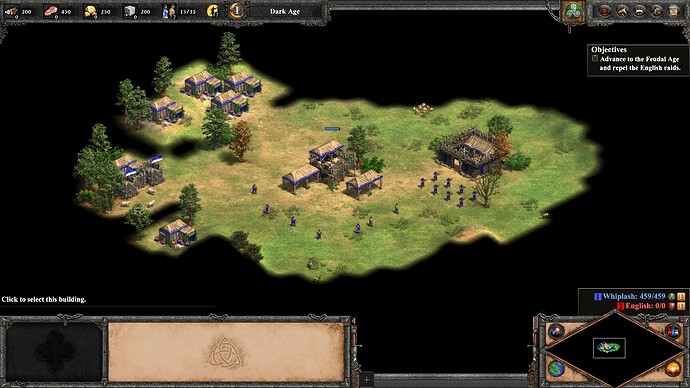
<p>Let me illustrate this point with an analogy to the computer game Age of Empires II, which I used to play as a kid. In AoEII, players build up a civilization from a small settlement into an empire by collecting resources to build infrastructure and mobilize an army against the other players vying for territory. If played properly, a black layer covers the entire map save for where your humble village is initialized. To find resources to build up your empire, you must send a scout on horseback into the darkness, a harrowing task given that you do not know where nearby enemies lurk and to what degree they have already mobilized.</p>

<p><img src="/assets/imgs/within_biking_distance/aoe2_black_map.jpeg" alt="AOEII map black" /></p>

<p>This captures how it feels to explore most American cities by bicycle. You ride out towards a park, or grocery store, or movie theater white-knuckling your handlebars, dodging 3-ton Ford F150s, and praying you don’t make a wrong turn and find yourself on a highway with 50+ MPH traffic, or as they are called in California, roads. A breezy 20-minute ride feels like an anxious hour. If you are lucky, you will have discovered one sort-of-safe route through the darkness, but more likely you will throw your tear-soaked bike into storage in defeat.</p>

<p>In AoEII, the cheat codes “marco” and “polo” instantly made the entire map visible, giving players assurance to venture out in all directions and avoid danger without the need for tedious and risky scout missions. I designed the map widget with this cheat code in mind, to imagine a counterfactual world in which you don’t have to think twice about your safety as you head out on a bicycle. Of course, this comes at a great cost of inconvenience on car-free Saturdays, but we need not outlaw cars to make our imagined world reality. We should instead install comprehensive bicycle networks, joining cities like Copenhagen, Amsterdam, Utrecht, Paris, and Montreal.</p>

<p>A comprehensive bicycle network is one that connects virtually all points in a city via safe routes such that the person setting out on bike does not have to think or worry at all that they’ll reach their destination in one piece. Copenhagen, which I had the pleasure of visiting, has a comprehensive bicycle network. After a hour or two starring destinations on Google Maps, and a few minutes chatting with the hotel concierge about safety tips and norms – hand signals, no left turns, pass on the left, how to use a wheel lock – I was off. I made it everywhere I wanted to go and discovered even more along the way. Their bicycle network consists of a combination of raised, separated lanes on major corridors (think a second sidewalk), shared lanes on side streets with extremely calm local car traffic, and dedicated bike paths galore, all seamlessly, continuously woven through residential areas and commercial areas, pleasant parks and hopping downtown centers. Basically, it’s impossible to get off piste, the same expectation we Americans have of our road networks.</p>

<p>A common rejoinder states that American cities are simply too sprawling for bicycles to make sense. I hope the map widget and an imagined car-free Saturday showed some of the cracks in this argument. At the end of this article, I will sketch a pro-bike vision of the future which I call Patchwork Quilt, U.S.A.</p>

<p>Before that, I’ll argue why we should even bother with this endeavor beyond the incontrovertible truths that riding a bike is fun, safe, and convenient. Car-centrism is a major culprit in the triple crisis facing American cities. By effectively mandating the car as the only transportation option in our cities, we fritter away critical resources: energy, space, and cash, three inputs to the pursuit of happiness made scarce by our own hand.</p>

<h3 id="the-crisis-of-energy-balancing-the-budget"><strong>The crisis of energy: balancing the budget</strong></h3>
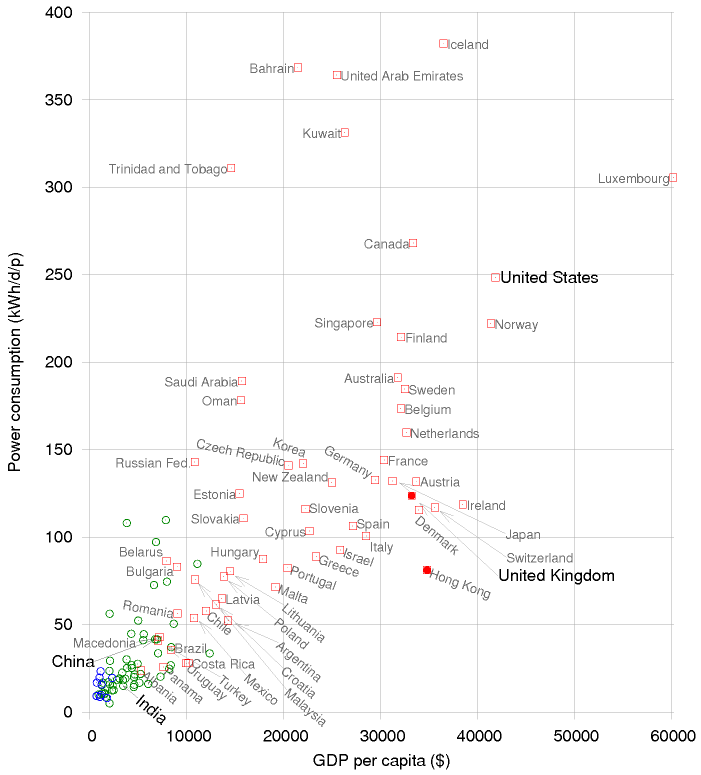
<p>All the good stuff in life requires energy. This is roughly demonstrated in the chart below which plots power consumption per capita against GDP per capita.</p>

<p><img src="/assets/imgs/within_biking_distance/sewtha_gdp_v_power.png" alt="SEWTHA power consumption per capita vs GDP per capita" /></p>

<p>This, and many other important facts are clearly discussed in <em>Sustainable Energy without the Hot Air</em> (SEWTHA) by David MacKay, which you can access online for free.<sup id="fnref:4" role="doc-noteref"><a href="#fn:4" class="footnote" rel="footnote">4</a></sup> I will adopt MacKay’s practical, quantitative attitude toward the subject here, leaving out “Hot Air” in the sense of B.S., but also the subject of climate change, which is decidedly not B.S., but which we do not need for the present discussion. This is just a business discussion.</p>

<p>All businesses, from the lemonade stand to the household to the multi-national corporation, stand upon the same basic foundation, a single number counting how much earned less what was spent. Though the management of a business may feature many complexities – multiple stakeholders, supply chains, equipment – and while a growing business can for years defy gravity, in the end, for the business to sustain, that single number, the bottom line, must be positive. Sustainable energy is a business. It has complexities ranging across physics, chemistry, and climatology that would make supply chain managers at Amazon, Apple, or Toyota cower in fear, but it too boils down to the bottom line which differs only in that the measured currency is energy, not cash.</p>

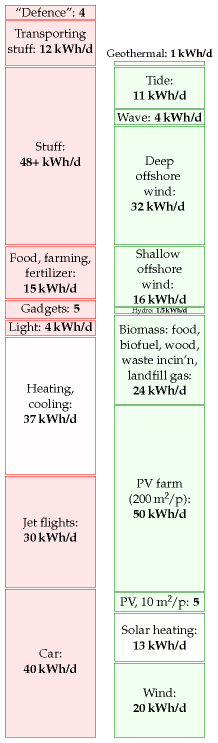
<p>The central figure from SEWTHA shows an energetic profit and loss statement.</p>

<p><img src="/assets/imgs/within_biking_distance/total_stack_compare_mackay_sewtha.png" alt="SEWTHA energy profit and loss statement" /></p>

<p>Energy is measured in units of kilowatt hours per person per day (kWh / d). For reference, if you left a 40-watt lightbulb on for 1 day, you will have used about 1 kWh (40 x 24 ~ 1,000). Energy consumption in red is categorized by use and an estimate of in principle sustainable energy generation is shown in green. There are several caveats. MacKay’s discussion centers around a British citizen of above-average means, and it is by now slightly outdated. However, his analysis is from first principles and has held up fairly well over time. Things will vary from country to country of course. For example, the average American consumes about 50% more than the above-average Briton.</p>

<p>The main point is that margins are tight. The red stack and the green stack are about the same size. We should pursue both top-line growth in energy generation and cost-cutting initiatives to keep the business afloat. The red block labeled “Car” represents the energetic cost of <em>operating</em> a car and is the second biggest block (21% of total consumption). Add to that the cost of <em>manufacturing</em> a car which is the largest component (14 kWh / d) of the largest block, “Stuff”. Counted this way, the car becomes the single largest red block at 54 kWh / d or 28% of total consumption! Let’s put on our consultant hats and look for <em>efficiencies</em>.</p>

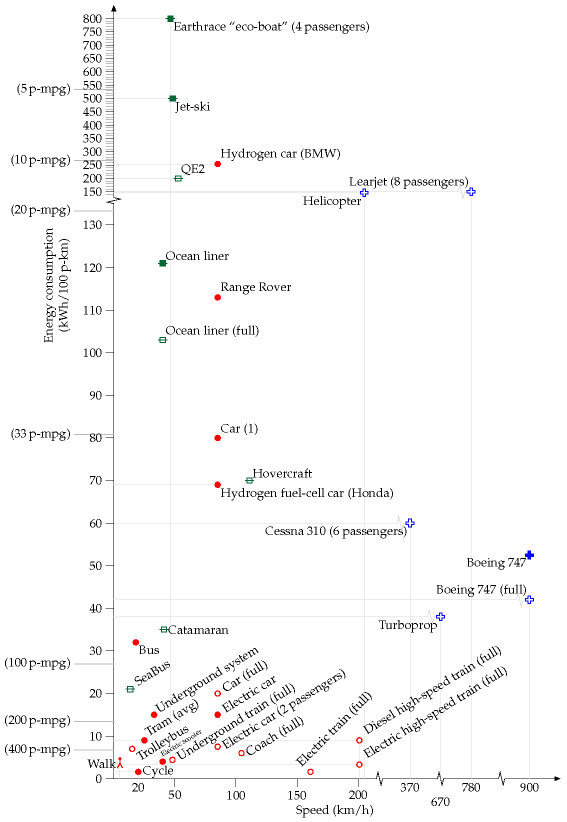
<p>Here’s one more SEWTHA figure showing energy efficiency vs speed for various modes of transportation.</p>

<p><img src="/assets/imgs/within_biking_distance/better_transport_energy_vs_speed_mackay_sewtha.png" alt="SEWTHA better transportation" /></p>

<p>The bicycle is the king of the y-axis, which measures energy efficiency in kWh per 100 person-kilometers, in other words what it takes to move 100 people 1 km down the road (or 1 person by 100 km, 25 x 4 etc). Only the rush hour electric train gives it a run for its money.</p>

<p>40% of all car trips are of bikeable length in the U.S. (&lt; 3 miles), representing 7% of all distance driven.<sup id="fnref:3:1" role="doc-noteref"><a href="#fn:3" class="footnote" rel="footnote">3</a></sup> This translates to 4 kWh / d or 2% of total consumption. Shifting these trips from cars to bikes would reduce this spending by an order of magnitude. For context, this roughly equals the savings of converting all your incandescent bulbs to LEDs or committing to eat vegetarian for 3 days of the week. Nothing to sneeze at for such modest behavioral changes.</p>

<h3 id="violet-beauregarde-and-the-crisis-of-space"><strong>Violet Beauregarde and the crisis of space</strong></h3>
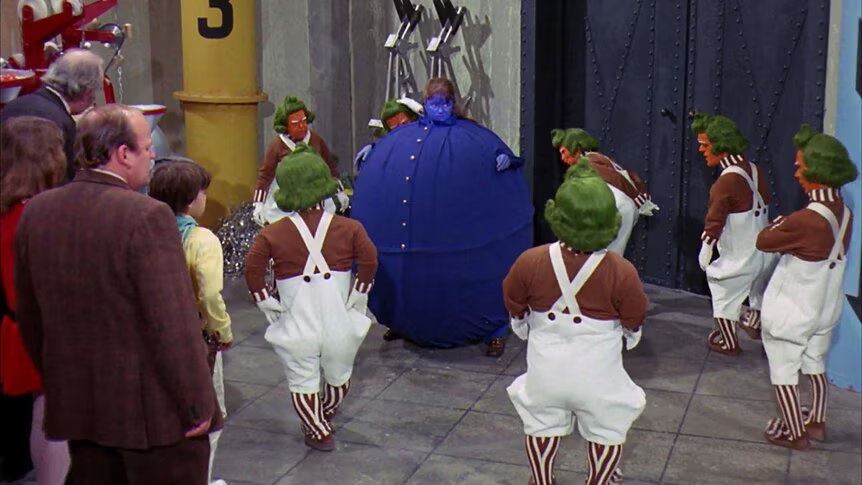
<p>Violet Beauregarde in <em>Charlie and the Chocolate Factory</em> chews Three-Course Dinner Chewing Gum despite warnings from Willy Wonka that it was still experimental. Consequently, she becomes grossly inflamed and sends the Oompa-Loompas into an immunogenic tizzy. If instead they had taken Violet’s actions as encouragement to break rank with their eccentric leader and tasted the Three-Course Dinner Chewing Gum for themselves, right there on the at-capacity manufacturing floor, the ensuing mayhem would have resembled rush hour in an American city. Only our car-dependence is much worse.</p>

<p><img src="/assets/imgs/within_biking_distance/violet-beauregarde-blueberry.avif" alt="Violet Beauregarde" /></p>

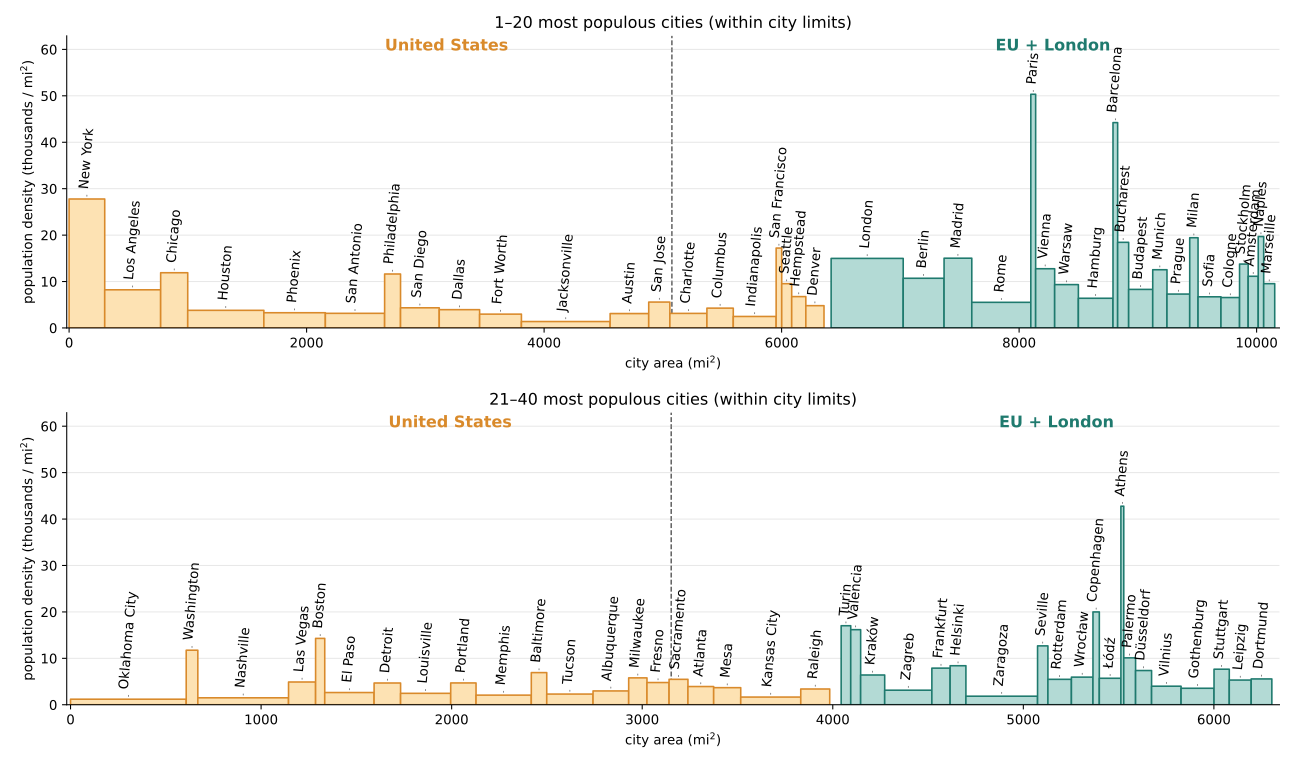
<p>Travelling by car, we expand to 40 times our size!<sup id="fnref:5" role="doc-noteref"><a href="#fn:5" class="footnote" rel="footnote">5</a></sup> And while we shrink down to normal before we go back indoors, our monstrous blueberry carapaces idle for over 20 hours a day. To accommodate cars, our cities have ballooned in size. American cities are 2 times larger than European cities by land area and contain half as many people per unit area.<sup id="fnref:6" role="doc-noteref"><a href="#fn:6" class="footnote" rel="footnote">6</a></sup></p>

<p><img src="/assets/imgs/within_biking_distance/city_marimekko.svg" alt="US vs EU city marimekko" /></p>

<p>We allot so much space for cars that we are now struggling to find room for people. On average, 22% of land <em>in the city center</em> is devoted to parking lots.<sup id="fnref:7" role="doc-noteref"><a href="#fn:7" class="footnote" rel="footnote">7</a></sup> Multi-lane highways tear through neighborhoods. Traffic is grueling and looms large in the minds of homeowners as they push back on efforts to develop housing. 63% of respondents in a Sacramento survey said their primary concern with new housing was its impact on traffic and parking, far more than mentions of neighborhood character, school overcrowding, or crime.<sup id="fnref:8" role="doc-noteref"><a href="#fn:8" class="footnote" rel="footnote">8</a></sup></p>

<p>Bicycles take up 4 times less space than cars. Even if everyone upgraded to the Urban Arrow Family<sup id="fnref:9" role="doc-noteref"><a href="#fn:9" class="footnote" rel="footnote">9</a></sup>, the crown jewel of bakfiet-style e-bikes, their footprint would be nearly 3 times less than a midsize sedan. Trading cars for bikes would relieve pressure on space constraints by multiples while maximizing autonomy and flexibility. Every individual could ride alone when they needed without taking up space for 40. Children could take themselves to soccer.</p>

<p>Other car-centric ideas to save space like carpooling and autonomous vehicles are hard-pressed to achieve these space savings multiples. Vehicles would have to be fully occupied <em>on average</em> compared to the current estimate of 1.5 passengers per vehicle. In theory autonomous vehicles could do better but one wonders if the peak demand during rush hour and consumer preferences will allow it. A sensible estimate is that robotaxis will have usage rates like taxis, 1.2.<sup id="fnref:10" role="doc-noteref"><a href="#fn:10" class="footnote" rel="footnote">10</a></sup> Even with ridesharing offers like Uber Pool and Lyft Line, occupancy barely budges to 1.3.<sup id="fnref:11" role="doc-noteref"><a href="#fn:11" class="footnote" rel="footnote">11</a></sup></p>

<h3 id="the-crisis-of-affordability-cars-are-just-expensive"><strong>The crisis of affordability: cars are just expensive</strong></h3>
<p>Cars are expensive. All-in, they cost about $13,000 per year, or roughly 17% of the average budget.<sup id="fnref:12" role="doc-noteref"><a href="#fn:12" class="footnote" rel="footnote">12</a></sup> This makes them the second largest category behind housing and a head of food with no comparison in terms of accommodation or flavor. The median new and used car will run you $50,000 and $25,000, respectively. A sturdy bicycle might set you back hundreds of dollars. You can trade up to an e-bike for single thousands. I’ll let you decide where to put that chunk of change erstwhile tied up in a stuck-in-traffic Toyota Camry.</p>

<h3 id="patchwork-quilt-usa"><strong>Patchwork Quilt, U.S.A.</strong></h3>
<p>The triple crisis facing American cities has been a long time coming. Adhering to a car-centric pattern of development has seen urban land area grow 1.4 times faster than the population between 1960 and 2020. The average distance driven per person-day has doubled from 20 to 40 miles in that same period.<sup id="fnref:13" role="doc-noteref"><a href="#fn:13" class="footnote" rel="footnote">13</a></sup> Thankfully, support for densification and transit-oriented development is now increasing. Still, the last half century of development has left us with an uphill climb toward healthier cities. Bikes should factor heavily into that end-state, but perhaps as crucially can serve as a stepping stone to ensure we get there.
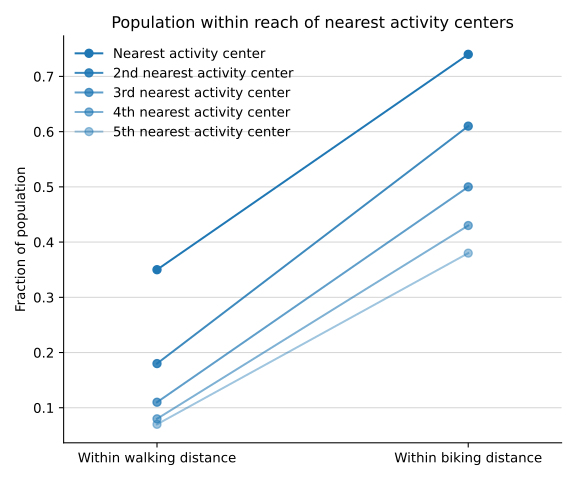
By and large, our sprawling cities are not walkable. We cannot simply fold them up into the walkable size of peer cities in Europe. But take a closer look, as you did through the lens of the map widget, and you realize there is just enough clustering of homes and points of interest, not on the scale of walking, but on the scale of biking to offer an opportunity. A study from the Brookings Institute points toward a similar conclusion. Here, is a summary of the fraction of people within walking and biking distances from “activity centers”, clusters of stores, offices, amenities, etc. in the largest 110 U.S. metro areas.</p>

<p><img src="/assets/imgs/within_biking_distance/activity_center_proximity.svg" alt="Brookings activity centers walk vs bike" /></p>

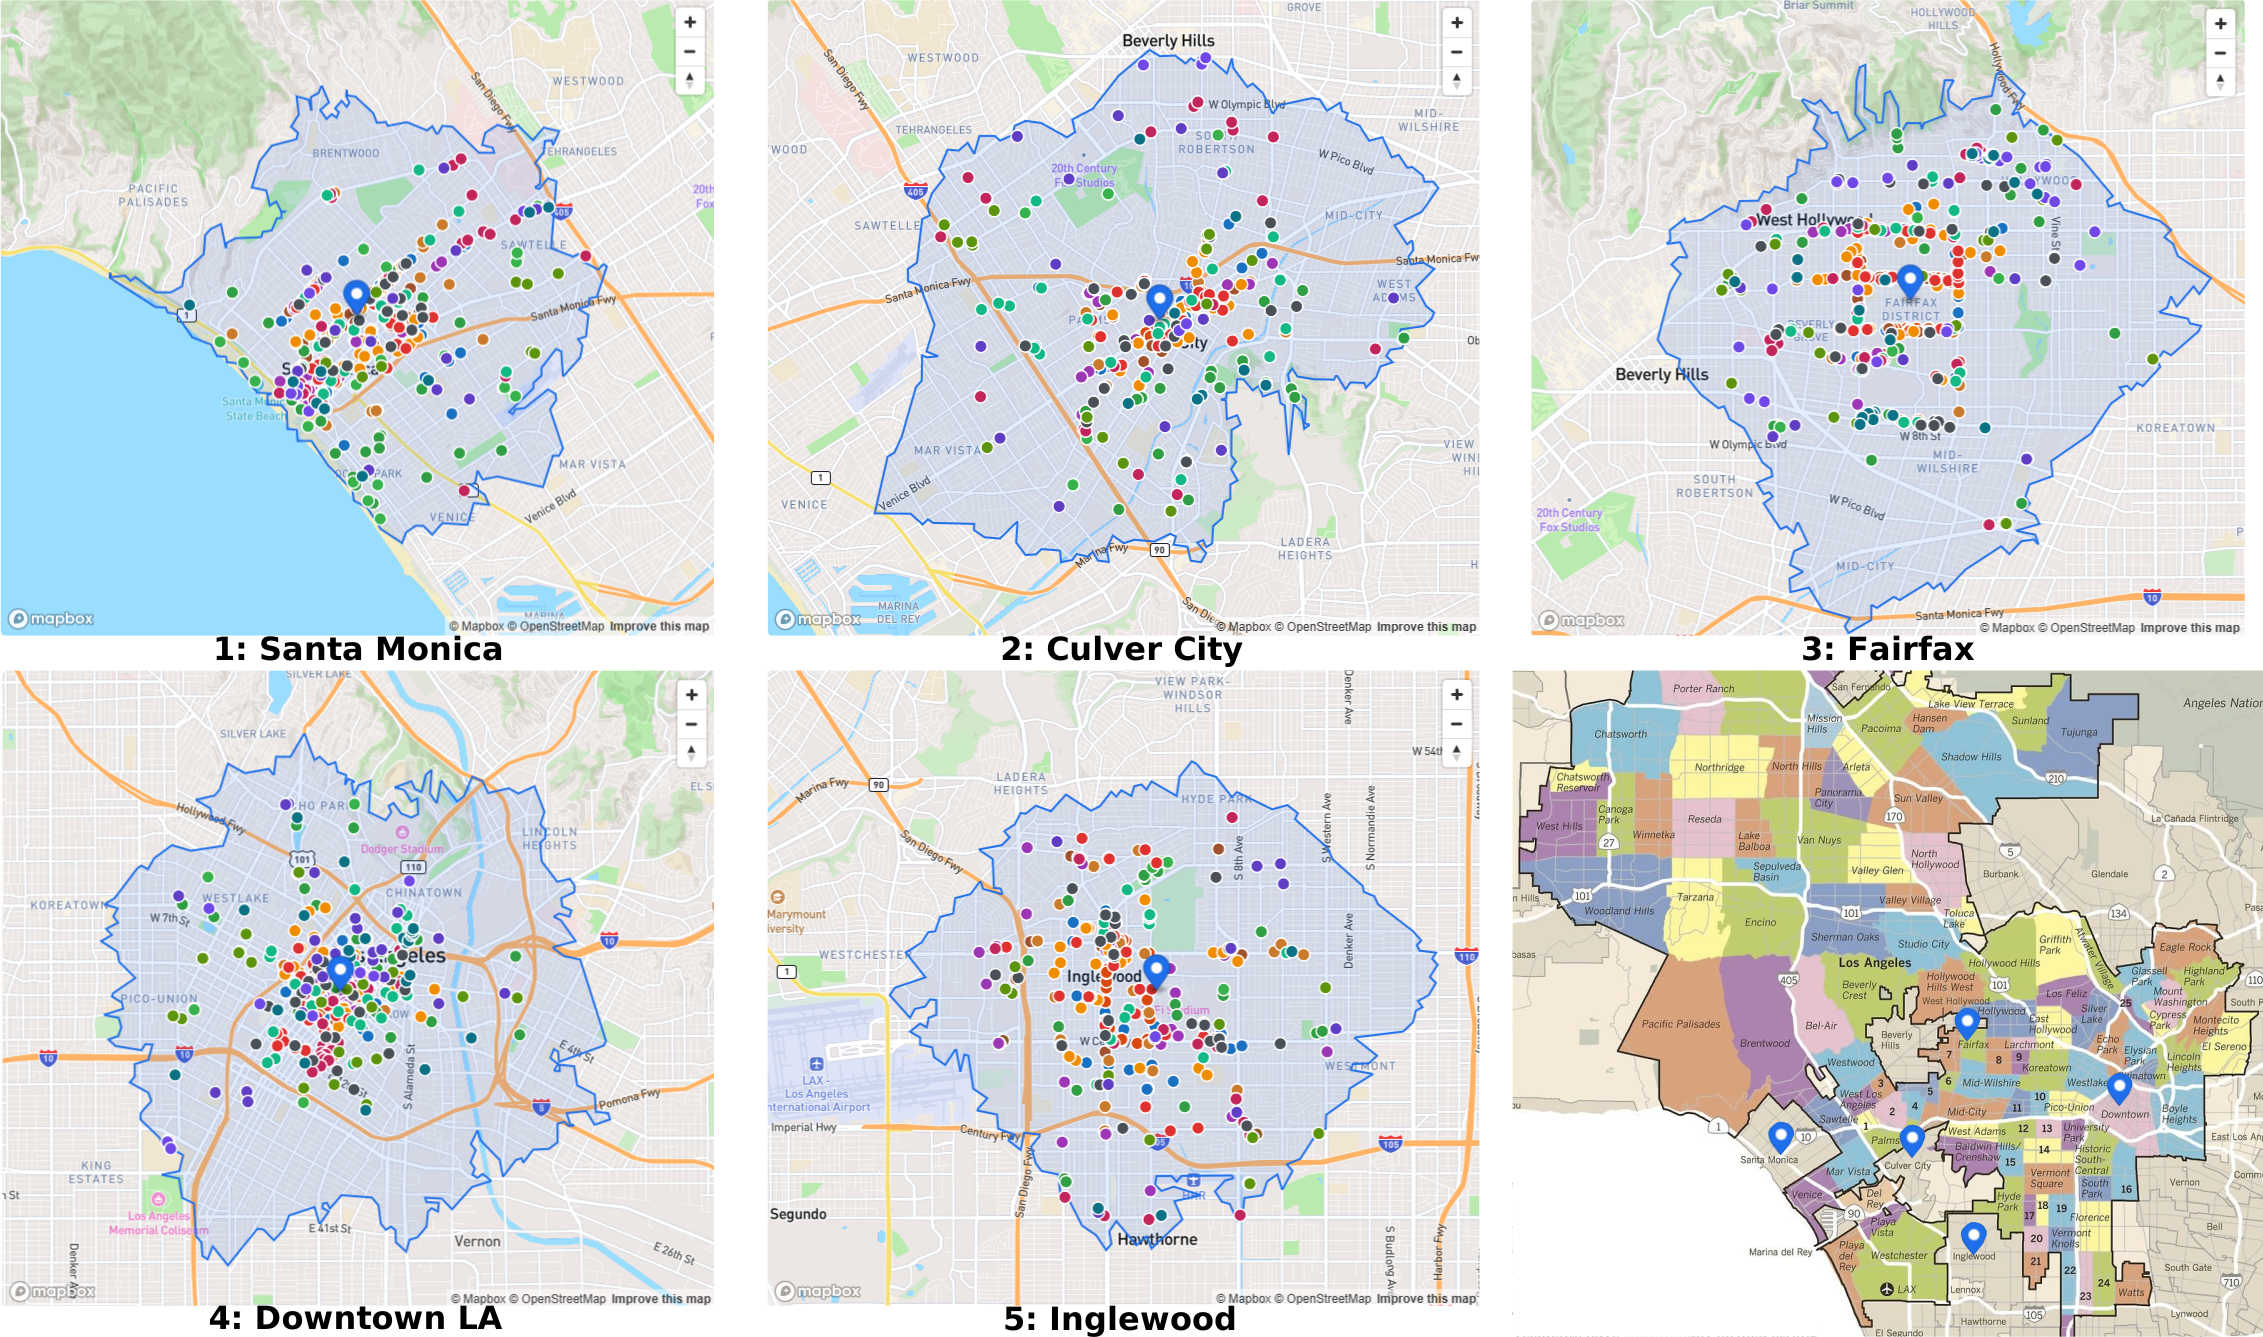
<p>We cannot fold up our cities, but we can knit together their patchwork of bikeable neighborhoods into a colorful and vibrant quilt. Consider Los Angeles, paragon of sprawl and car-centrism, 471 square miles of city. It is also true that 74% of the population lives within 3 miles of <em>5 separate activity centers</em>, compared to the national average of 38%.<sup id="fnref:13:1" role="doc-noteref"><a href="#fn:13" class="footnote" rel="footnote">13</a></sup> If tomorrow LA decided to build a comprehensive bicycle network, three quarters of their population would suddenly have car-free access to a wealth of amenities. The construction needs not proceed all at once. City planners could gradually experiment patch by bikeable patch. It would take approximately 17 patches to cover the entire city area, a more manageable number than the 157 patches that walking requires. Here are a few examples to give you a picture. The bottom right image shows where the 5 patches fall on a map of LA neighborhoods.<sup id="fnref:14" role="doc-noteref"><a href="#fn:14" class="footnote" rel="footnote">14</a></sup></p>

<p><img src="/assets/imgs/within_biking_distance/example_la_neighborhoods.svg" alt="LA bikeable patches" /></p>

<p>I am not against walkability or further densification, but I see the obstacles blocking progress toward this goal as thorny and feeding into one another in vicious ways. Expensive transit construction projects seem foolhardy when passengers may only ride them to pedestrian wastelands. Densifying areas to the point of walkability requires both taking space away from cars and adding more of it for the higher concentration of people whose only recourse is to drive there. No one takes the bus because it’s snarled in traffic. And in our desperation, we become willing to suspend disbelief that robotaxis will so significantly break the mould of homotaxis.</p>

<p>We can turn this vicious cycle into a virtuous (bi)cycle. Bikes are more energy efficient, take much less space, and are radically more affordable than cars. Further densification is not required from the jump. We need only build a comprehensive bicycle network at a cost of pennies and dimes on the dollar per mile compared to car lanes.<sup id="fnref:15" role="doc-noteref"><a href="#fn:15" class="footnote" rel="footnote">15</a></sup> Once patches of bikeable neighborhoods take root, the case for investing in rapid transit lines between them becomes stronger. Less traffic on the road makes way for faster buses. Less required parking would take the edge off challenges to build more housing. Not much convenience is lost. Driving a car within a bikeable region may be twice as fast but after looking for parking, drivers save just a few minutes off the trip. With fewer cars on the road making short trips, drivers who need to travel longer distances will hit less traffic.</p>

<p>Bikes won’t solve everything. One nasty fly in the ointment is the fact that the average American commute is about 16 miles one-way, which makes biking to work a non-starter for most.<sup id="fnref:16" role="doc-noteref"><a href="#fn:16" class="footnote" rel="footnote">16</a></sup> But I hope you’ll agree that bicycles are a serious and bona fide mode of transportation in addition to being a fun way to cruise through the park or get some exercise. Their combination of energy efficiency, space efficiency, and speed relative to walking position them uniquely to catalyze the transition to a new equilibrium, Patchwork Quilt, U.S.A., in which Americans are wealthier in terms of energy, space, and cash, and freer to pursue happiness.</p>

<h3 id="postscript-actions-you-can-take-within-biking-distance"><strong>Postscript: actions you can take, within biking distance</strong></h3>
<p>Patchwork Quilt, U.S.A. will require building bicycle infrastructure and increasing its use. One feeds the other. There are a number of actions you can take which scale with the amount of time you can shake free from your day-to-day schedule. I can say from experience that getting involved with bike advocacy brings you closer to your neighbors as after all, choices about how to build bicycle infrastructure are specific to where you live. But the community is also global. You’ll start to notice lots of like-minded people when you travel and on the internet. It’s a nice feeling.</p>

<p>Roughly from least to most time intensive:</p>

<ol>
  <li>Talk to someone else about bikes. Share this article. Share any article or video. There are a lot out there. Off the top of my head: <a href="https://www.youtube.com/c/notjustbikes">Not Just Bikes</a>, <a href="https://www.strongtowns.org/">Strong Towns</a>, <a href="https://www.peopleforbikes.org/">People for Bikes</a>, <a href="https://usa.streetsblog.org/">Streetsblog</a>, <a href="https://www.youtube.com/CityNerd">CityNerd</a>, <a href="https://www.youtube.com/citybeautiful">City Beautiful</a>.</li>
  <li>Ride your bike. Find somewhere you could go – a park, café, restaurant, library, your office if you’re lucky – plan how to get there, and go. If you don’t have a bike, check if you can take a bikeshare like <a href="https://citibikenyc.com/">Citi Bike</a>, <a href="https://bluebikes.com/">Bluebikes</a>, <a href="https://divvybikes.com/">Divvy</a>, etc. Go when the weather’s nice. Please wear a helmet.</li>
  <li>Ride your bike again. Start thinking about where the most impactful new bike lanes might go. Don’t stop.</li>
  <li>Ride regularly. If that means you must first buy a bike, check Facebook Marketplace for deals. Check out used bicycle shops in your area. Try to save money but make sure you get something sturdy.</li>
  <li>Ride your bike when it’s crappy weather out. (See FAQs)</li>
  <li>Look up or somehow try to find local bicycle advocacy groups near you. I got lucky one day when some dude passed me a business card for the <a href="https://www.evanstontransitalliance.org/">Evanston Transit Alliance</a>.</li>
  <li>Participate in events and meetings for the advocacy group.</li>
  <li>If you’re unlucky but ambitious, start a local advocacy group! I was lucky so I don’t have this experience but if you are interested, email the Evanston Transit Alliance, or some group in a city other than yours, for pointers.</li>
  <li>Figure out how local politics work, even if just a little bit. I’m not exactly a political operator, but over time, I’ve at least learned who my local city council person is, how to contact them, and how to turn up to community feedback meetings. Go little by little. You might surprise yourself.</li>
</ol>

<p>I see a lot of momentum for bikes out there, so perhaps you will too. I’ve visited or lived in New York City (especially Brooklyn), Boston / Cambridge, and the North Side of Chicago / Evanston, all of which are at various points on a journey toward a comprehensive bicycle network and significant ridership. To achieve this goal will require infrastructure, politics, and cultural change. It will require that we connect with our neighbors and work together. Email me if there is anything you want to talk through.</p>

<h3 id="faqs"><strong>FAQs</strong></h3>
<p>When you’re riding your bike, how do you deal with…</p>

<p>…rain?
…cold?
…sweat?
…darkness?
…bike breaks?
…carrying stuff?
…keeping your clothes clean?</p>

<p>Perhaps in a forthcoming post I will share my personal tips on how to be a regular utility biker. For now, I’ll just link you to The Guardian’s recent article <sup id="fnref:17" role="doc-noteref"><a href="#fn:17" class="footnote" rel="footnote">17</a></sup></p>

<h3 id="footnotes"><strong>Footnotes</strong></h3>

<div class="footnotes" role="doc-endnotes">
  <ol>
    <li id="fn:1" role="doc-endnote">
      <p><a href="https://en.wikipedia.org/wiki/CARES_Act">American Cares Act</a> <a href="#fnref:1" class="reversefootnote" role="doc-backlink">&#8617;</a></p>
    </li>
    <li id="fn:2" role="doc-endnote">
      <p><a href="https://en.wikipedia.org/wiki/Urbanization_in_the_United_States">80% of Americans living in urban areas</a> <a href="#fnref:2" class="reversefootnote" role="doc-backlink">&#8617;</a></p>
    </li>
    <li id="fn:3" role="doc-endnote">
      <p><a href="https://nhts.ornl.gov/vehicle-trips">3 miles long, in other words, a breezy 20-minute bike ride</a> <a href="#fnref:3" class="reversefootnote" role="doc-backlink">&#8617;</a> <a href="#fnref:3:1" class="reversefootnote" role="doc-backlink">&#8617;<sup>2</sup></a></p>
    </li>
    <li id="fn:4" role="doc-endnote">
      <p><a href="https://www.withouthotair.com/">Sustainable Energy without the Hot Air</a> <a href="#fnref:4" class="reversefootnote" role="doc-backlink">&#8617;</a></p>
    </li>
    <li id="fn:5" role="doc-endnote">
      <p>Assuming we all travel by mid-sized sedan at an average occupancy of 1.5 passengers per vehicle. <a href="#fnref:5" class="reversefootnote" role="doc-backlink">&#8617;</a></p>
    </li>
    <li id="fn:6" role="doc-endnote">
      <p><a href="https://worldpopulationreview.com/us-cities">American city data</a> <a href="https://en.wikipedia.org/wiki/List_of_cities_in_the_European_Union_by_population_within_city_limits">EU city data</a> <a href="#fnref:6" class="reversefootnote" role="doc-backlink">&#8617;</a></p>
    </li>
    <li id="fn:7" role="doc-endnote">
      <p><a href="https://thehill.com/changing-america/resilience/smart-cities/4162455-paved-paradise-maps-show-how-much-of-us-cities-are-parking-lots/">22% of land <em>in the city center</em> is devoted to parking lots</a> <a href="#fnref:7" class="reversefootnote" role="doc-backlink">&#8617;</a></p>
    </li>
    <li id="fn:8" role="doc-endnote">
      <p><a href="https://www.valleyvision.org/resources/the-built-environment-poll-may-2023/">63% of respondents …said their primary concern …impact on traffic and parking</a> <a href="#fnref:8" class="reversefootnote" role="doc-backlink">&#8617;</a></p>
    </li>
    <li id="fn:9" role="doc-endnote">
      <p><a href="https://www.urbanarrow.com/family-bikes/family">Urban Arrow Family</a> <a href="#fnref:9" class="reversefootnote" role="doc-backlink">&#8617;</a></p>
    </li>
    <li id="fn:10" role="doc-endnote">
      <p><a href="https://teslamotorsclub.com/tmc/threads/what-is-the-occupancy-rate-of-driverless-taxis.272571/">usage rates like taxis, 1.2</a> <a href="#fnref:10" class="reversefootnote" role="doc-backlink">&#8617;</a></p>
    </li>
    <li id="fn:11" role="doc-endnote">
      <p><a href="https://rosap.ntl.bts.gov/view/dot/42496/dot_42496_DS1.pdf">occupancy barely budges to 1.3</a> <a href="#fnref:11" class="reversefootnote" role="doc-backlink">&#8617;</a></p>
    </li>
    <li id="fn:12" role="doc-endnote">
      <p><a href="https://www.bls.gov/news.release/cesan.nr0.htm#:~:text=Percent%20distribution%20of%20total%20annual,to%20100.0%20due%20to%20rounding.">Cars are expensive</a> <a href="#fnref:12" class="reversefootnote" role="doc-backlink">&#8617;</a></p>
    </li>
    <li id="fn:13" role="doc-endnote">
      <p><a href="https://www.brookings.edu/articles/building-for-proximity-the-role-of-activity-centers-in-reducing-total-miles-traveled/">Tomer and George. (2023). Building for proximity: the role of activity centers in reducing total miles traveled. Brookings Institute.</a> <a href="#fnref:13" class="reversefootnote" role="doc-backlink">&#8617;</a> <a href="#fnref:13:1" class="reversefootnote" role="doc-backlink">&#8617;<sup>2</sup></a></p>
    </li>
    <li id="fn:14" role="doc-endnote">
      <p><a href="https://www.reddit.com/r/LosAngeles/comments/92y2gk/a_birdseye_view_of_all_114_districts_of_los/">LA neighborhoods</a> <a href="#fnref:14" class="reversefootnote" role="doc-backlink">&#8617;</a></p>
    </li>
    <li id="fn:15" role="doc-endnote">
      <p><a href="https://www.bikebulletin.com/p/the-true-cost-of-bike-lanes">pennies and dimes on the dollar per mile compared to car lanes</a> <a href="#fnref:15" class="reversefootnote" role="doc-backlink">&#8617;</a></p>
    </li>
    <li id="fn:16" role="doc-endnote">
      <p><a href="https://truedrivingcost.com/articles/average-commute-distance-by-state">average American commute is about 16 miles</a> <a href="#fnref:16" class="reversefootnote" role="doc-backlink">&#8617;</a></p>
    </li>
    <li id="fn:17" role="doc-endnote">
      <p><a href="https://www.theguardian.com/thefilter-us/2026/may/14/bike-bicycle-commuting-tips?CMP=Share_iOSApp_Other">Patterson. (Thursday, May 14, 2026). A beginner’s bike commuting gear guide: what to buy (and skip) before your first ride. The Guardian.</a> <a href="#fnref:17" class="reversefootnote" role="doc-backlink">&#8617;</a></p>
    </li>
  </ol>
</div>]]></content><author><name>Stefan Pate</name></author><category term="blog" /><category term="opinion" /><category term="sustainability" /><category term="bike" /><summary type="html"><![CDATA[Saturdays, henceforth, are declared car-free Imagine your government has declared that beginning next weekend, no passenger vehicle may be operated from midnight to midnight on Saturdays. Their intention is to save gasoline in the face of shortages resulting from the weeks-long closure of the Strait of Hormuz. If it was your government that caused the closure, you may be tempted to laugh sarcastically or rage. Stick with me. Imagine car-free Saturday has been given by order of the Peaky Blinders if it helps. Say it in Arthur’s voice to channel your rage. Your government (or the Shelby Company Limited) has committed to a stimulus package similar in magnitude to the American CARES Act.1 Eligible adults may select any bicycle from this catalogue including accessories like milk crates, baskets, or saddle bags, and credits are available for dependents that can be applied to children’s bikes and cargo bikes for families. Logistics companies have been contracted to deliver these items to your home. American Cares Act &#8617;]]></summary></entry><entry><title type="html">An analysis of three-point shooting in the NBA</title><link href="https://stefanpate.github.io/blog/opinion/analysis/sports/2025/11/19/nba-3.html" rel="alternate" type="text/html" title="An analysis of three-point shooting in the NBA" /><published>2025-11-19T15:00:00+00:00</published><updated>2025-11-19T15:00:00+00:00</updated><id>https://stefanpate.github.io/blog/opinion/analysis/sports/2025/11/19/nba-3</id><content type="html" xml:base="https://stefanpate.github.io/blog/opinion/analysis/sports/2025/11/19/nba-3.html"><![CDATA[<h3 id="introduction"><strong>Introduction</strong></h3>

<p>The NBA finds itself in a complicated moment. Ratings are down<sup id="fnref:1" role="doc-noteref"><a href="#fn:1" class="footnote" rel="footnote">1</a></sup>. Overall popularity is up. The season has too many games which younger fans don’t watch, but which are required to feed an endless stream of short vertical clips. Contemporary greats – James, Curry, Durant – have regaled us with performances so excellent and sustained that their names and likenesses have become synonymous with the Association. At the same time they’ve cast their long shadows over the ascendance of bright young stars. Offensive play has reached new heights, so much so that the top brass put their thumbs on the balance of officiating last winter without ceremony<sup id="fnref:2" role="doc-noteref"><a href="#fn:2" class="footnote" rel="footnote">2</a></sup>. The Knicks are back baby! After eons of darkness, the beacon once again stands lit above MSG. But how long can a shallow depth chart burn the candle at both ends? Or maybe there are no simple moments in the NBA. Maybe the game and how it entertains keep changing as we nervously cling to last year’s edition. …or for Knick fans, cling to mediocrity since there is no hurt more painful than that preceded by hope.</p>

<p>The meteoric rise of three-point shooting volume in the past several years has been yet another source of consternation among fans, media, and former players. A striking heatmap of shots posted by Kirk Goldsberry displays this clearly<sup id="fnref:3" role="doc-noteref"><a href="#fn:3" class="footnote" rel="footnote">3</a></sup>. But the spirit of the critique is best embodied by a minute-long clip of the Boston Celtics and Toronto Raptors assiduously building a house of the Big Bad Wolf’s nightmares.</p>

<blockquote class="twitter-tweet" data-lang="en"><p lang="en" dir="ltr">BrickCenter (@BrickCenter_) <a href="https://x.com/i/status/1874191493998706910">https://x.com/i/status/1874191493998706910</a></p>&mdash; BrickCenter (@BrickCenter_) <a href="https://x.com/i/status/1874191493998706910"></a></blockquote>
<script async="" src="//platform.twitter.com/widgets.js" charset="utf-8"></script>

<p>Although the video misrepresents the vast skill of NBA players, it portrays well the monotony that results from an overemphasis of the three-point shot. Sports entertain most when gameplay is neither predictable nor predictably unpredictable. A faceoff between great opponents happens on a knife’s edge. No strike is landed without a counter, and constant counters plunge the competition deeper into the well of creativity. In my own circles, images of Jordan slicing and dicing<sup id="fnref:4" role="doc-noteref"><a href="#fn:4" class="footnote" rel="footnote">4</a></sup> through the midrange are often conjured in juxtaposition to the contemporary long-range catch-and-shoot aesthetic. But winning, not aesthetics is the primary objective of sports, making the unintended elegance more precious. We should not bemoan winning strategies that are metronomic. A repeat championship in Boston seemed inevitable before a tragic end of season, brick houses notwithstanding. And we should take care not to suffocate the game with incremental rule changes lest we drift towards Blernsball<sup id="fnref:5" role="doc-noteref"><a href="#fn:5" class="footnote" rel="footnote">5</a></sup>. Intervention should proceed deliberately, experimentally, and only if the natural evolution and diversity of gameplay seem stagnant under the existing rules. After all, the three-point line now on trial was originally introduced to “add excitement to the game”<sup id="fnref:6" role="doc-noteref"><a href="#fn:6" class="footnote" rel="footnote">6</a></sup>, was subsequently ignored for the better part of a decade<sup id="fnref:7" role="doc-noteref"><a href="#fn:7" class="footnote" rel="footnote">7</a></sup>, and in no way stymied the mid-range greatness of 90s and 00s players like Jordan and Kobe.
The reality is that a big change has occurred in the past decade and a half. It jumps out from the data. The change happened swiftly, suggesting it was memetic, and is consistent with a simple explanation that players and teams want to win. The distribution of shots now appears to be past this transition. It’s been steady for about the median length of an NBA career. Now is the time to start discussing the issue and planning possible solutions. I’ll provide an opinion on a couple solutions which have been passed around.</p>

<h3 id="shot-distribution-is-bi-tri-modal"><strong>Shot distribution is <del>bi-</del>tri-modal</strong></h3>

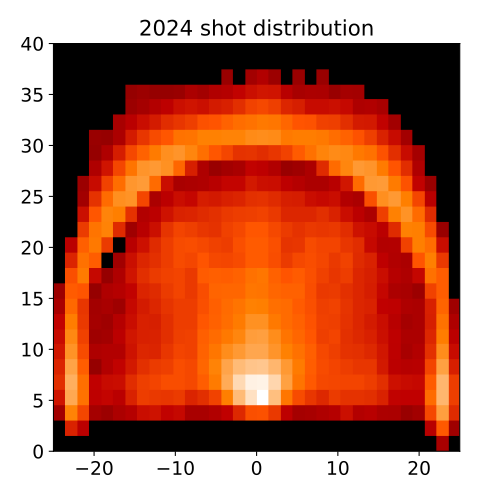
<p>If our hearts don’t deceive us as fans, we should see evidence of change in the shot distribution data<sup id="fnref:8" role="doc-noteref"><a href="#fn:8" class="footnote" rel="footnote">8</a></sup>. It should appear as a bimodal distribution of shots – hot spots near the basket and behind the three-point line, and relatively fewer shots in the mid-range between. Such a pattern is clear in a two-dimensional histogram of shots taken over the 2024 season. Hotter colors indicate higher density.</p>

<p><img src="/assets/imgs/nba3/shot_distribution_2024.svg" alt="2024 2D Shot Distribution" /></p>

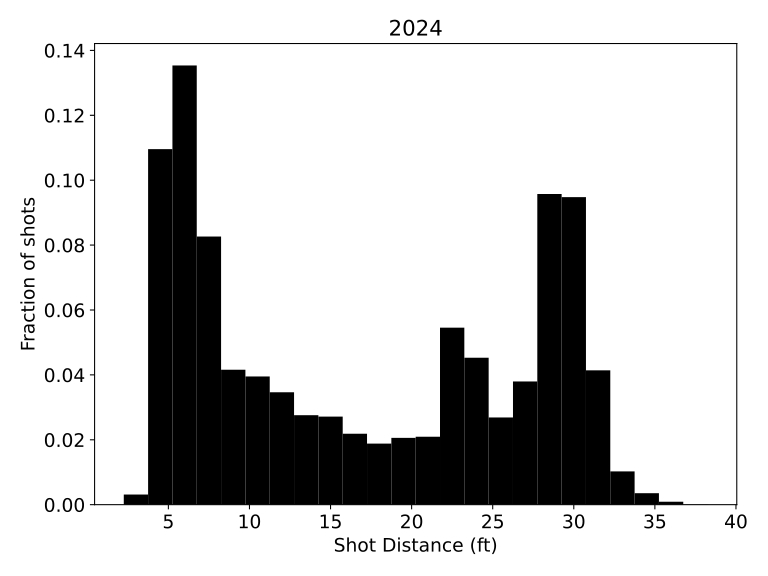
<p>But look at the picture when we sum together all shots taken at a given distance from the basket. We see a third mode appear.</p>

<p><img src="/assets/imgs/nba3/shot_distribution_vs_distance_2024.svg" alt="2024 Shot Distribution vs Distance" /></p>

<p>This middle mode, sitting just beyond 20 feet from the basket, corresponds to the corner three. This quirky solution to a lack of width in the NBA court provides a relatively easy opportunity to score three points. Eliminating this shot is the primary solution prescribed by Kirk Goldsberry in his The Ringer piece<sup id="fnref:3:1" role="doc-noteref"><a href="#fn:3" class="footnote" rel="footnote">3</a></sup>. The corner three draws extra criticism for being too easy a way to score three points. However, eliminating the corner three does not completely address the issue. Notice the towering mode straddling the 30 foot mark[#]. Our goal to encourage a variety of scoring strategies distributed all over the court corresponds in the histogram to deflating those giant peaks, taking their mass and spreading them out in a more uniform manner.</p>

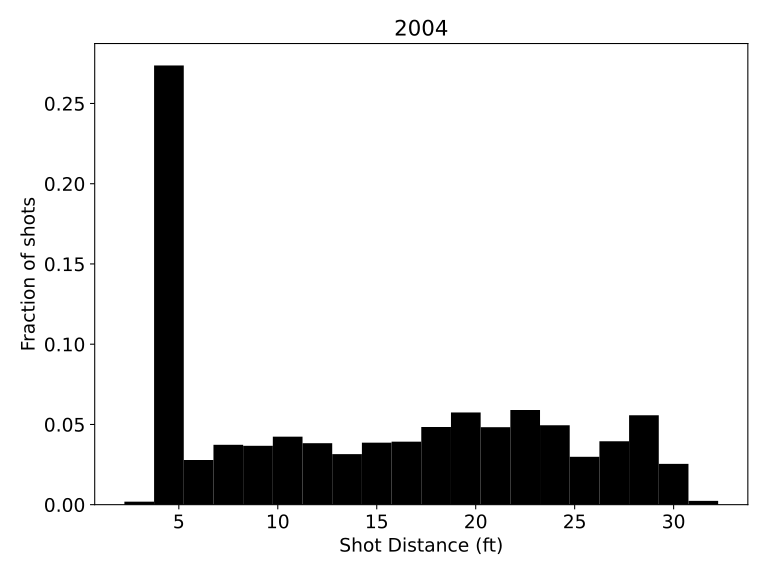
<p>The shot distribution in 2004 was more consistent with this picture.</p>

<p><img src="/assets/imgs/nba3/shot_distribution_vs_distance_2004.svg" alt="2004 Shot Distribution vs Distance" /></p>

<p>I don’t claim that 2004 was an apogee of competition or entertainment, only that the shot distribution was more uniformly spread across the floor. In fact, it was competition that drove the evolution toward a tri-modal shot distribution over the ensuing two decades.</p>

<p>Players distribute their shots tri-modally because it’s a winning strategy</p>

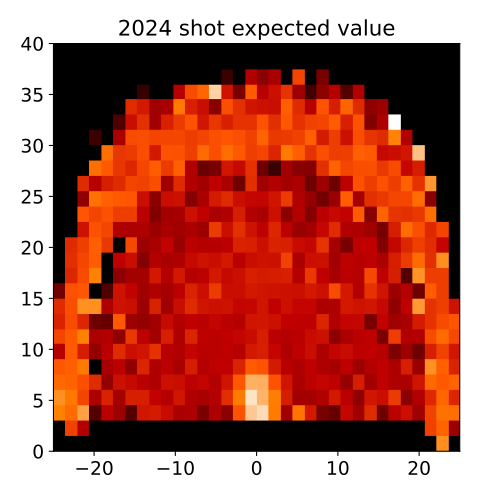
<p>This point may seem too obvious to make. Of course, all things equal, it’s better to score three points than two. But whether it pays to shoot the volume of three-point shots, distributed over the floor in the particular way we’ve seen, depends also on shooting percentage. The right metric to look at is expected value, the number of points expected per shot on average. When overlaid on the half-court, the picture bears a striking resemblance to shot distribution. Both exhibit hot spots near the basket and beyond the arc, with milder red colors in between.</p>

<p><img src="/assets/imgs/nba3/shot_expected_value_2024.svg" alt="2024 2D Shot Expected Value" /></p>

<p>But can we say definitively from this that the 2024 shot distribution is a winning strategy? We’ve only squinted at the two pictures and anyway they are plotted in different units. Shot distribution is counted in fractions of the total shots taken. Expected value is measured in points.</p>

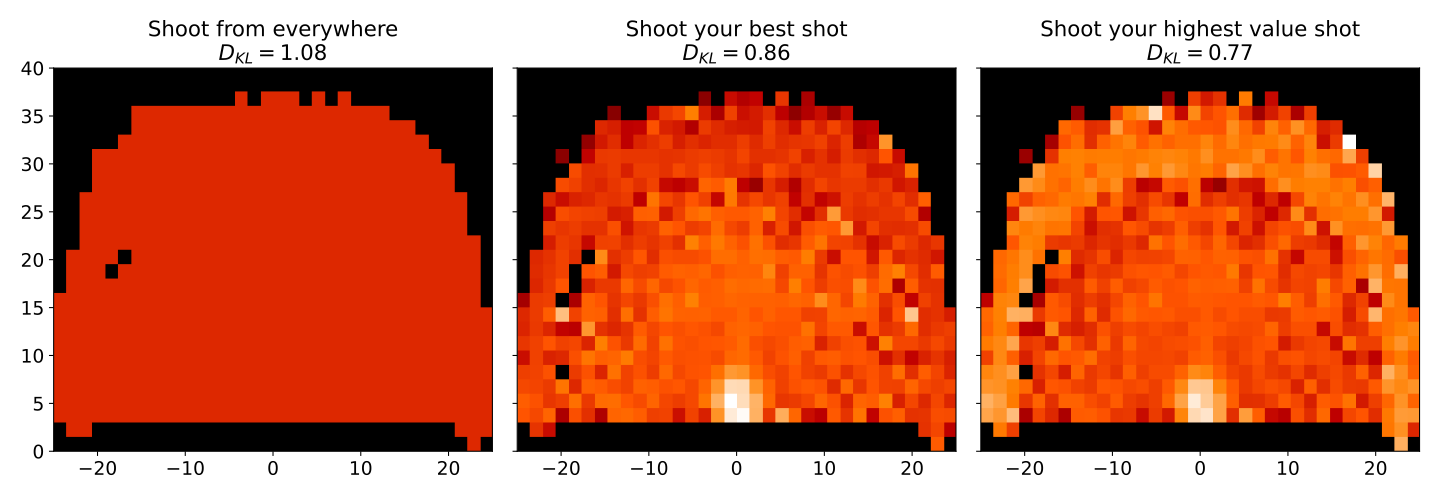
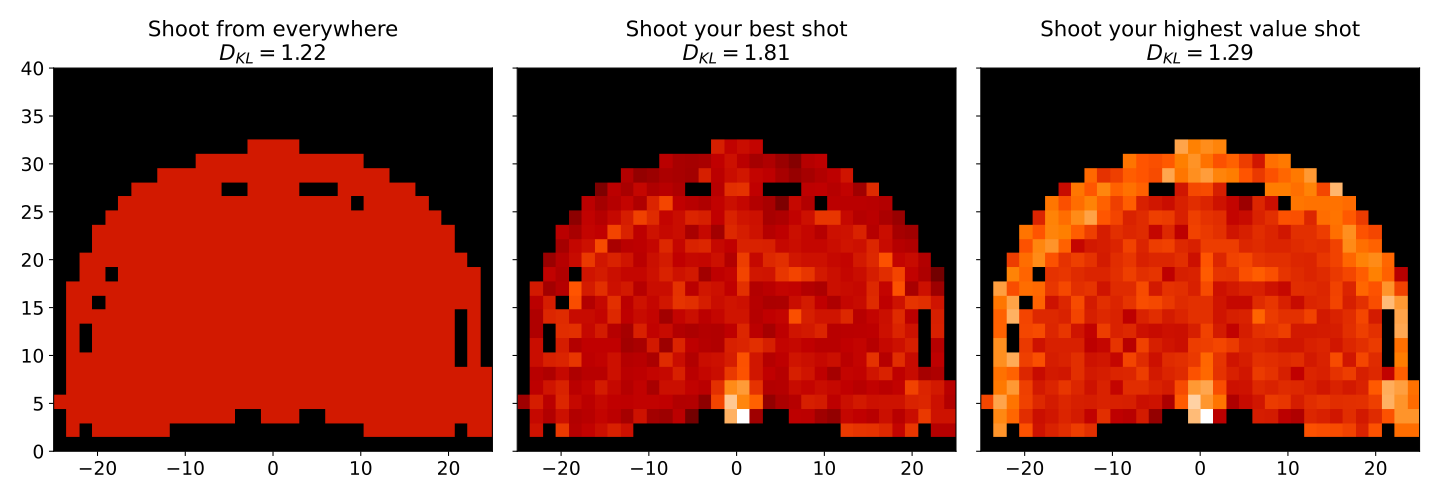
<p>To test my claim that shooting has moved toward a winning strategy, I’ve assumed that the fractions of shots taken over the course of a season are like probabilities and asked which of three hypothetical probability distributions best recapitulates the one we observed. The simplest hypothesis, “Shoot from everywhere”, says that a lot of things are going on in a basketball game: the offense dribbles and moves the ball to get a good shot, the defense works to deny them, coaches draw up schemes. In the end, it all cancels out, and shots go up from all over the court. The second hypothesis, “Shoot your best shot”, also assumes this chaos, but adds in that offensive players tend to take shots they are likely to make. The final hypothesis, “Shoot your highest value shot”, asserts that players don’t just shoot to make. They shoot to earn as many points as possible. Have a look at the shot distributions these three hypotheses predict<sup id="fnref:9" role="doc-noteref"><a href="#fn:9" class="footnote" rel="footnote">9</a></sup>.</p>

<p><img src="/assets/imgs/nba3/hypothetical_distributions_2024.svg" alt="2024 Hypothetical Distributions" /></p>

<p>“Shoot from everywhere” admittedly is a straw man but serves as a helpful point of reference. Both “Shoot your best shot” and “Shoot your highest value shot” get the hotspot around the basket right, but the latter better captures the three-point hotspot. Now that both hypothesis and ground truth are expressed in the same units of probability, there is a way to measure how far off they are<sup id="fnref:10" role="doc-noteref"><a href="#fn:10" class="footnote" rel="footnote">10</a></sup>. By this measure, “Shoot your highest value shot” is most consistent with the true 2024 shot distribution.</p>

<p>But this was not always the case. In 2004, the straw man “Shoot from everywhere” was a slightly better approximation of the true shot distribution than “Shoot your highest value shot”.</p>

<p><img src="/assets/imgs/nba3/hypothetical_distributions_2004.svg" alt="2004 Hypothetical Distributions" /></p>

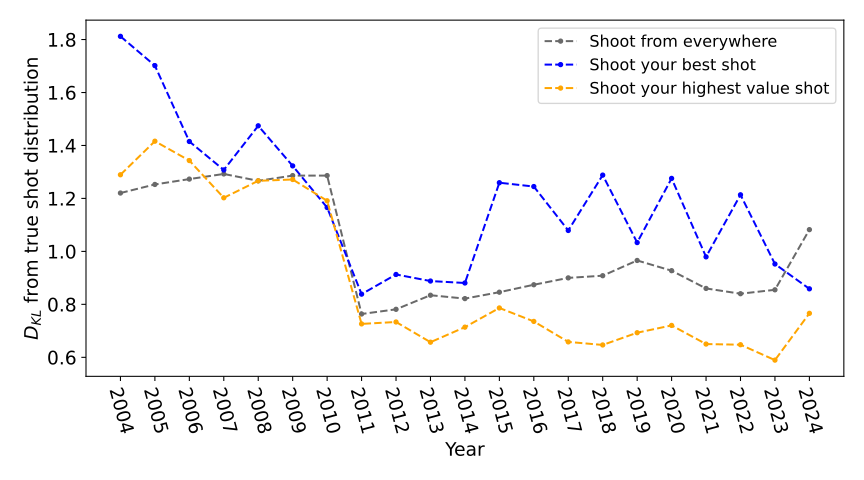
<p>The 2010s saw the value-optimizing strategy come to the fore, distancing itself from the other two hypotheses.</p>

<p><img src="/assets/imgs/nba3/dkl_historical_trends.svg" alt="Historical KL Divergence" /></p>

<p>This is conspicuous timing. At this time, NBA teams began embracing analytics<sup id="fnref:11" role="doc-noteref"><a href="#fn:11" class="footnote" rel="footnote">11</a></sup>. Analytics may have been the catalyst, but the potential for change was already present.</p>

<h3 id="the-winning-strategy-lay-in-wait"><strong>The winning strategy lay in wait</strong></h3>

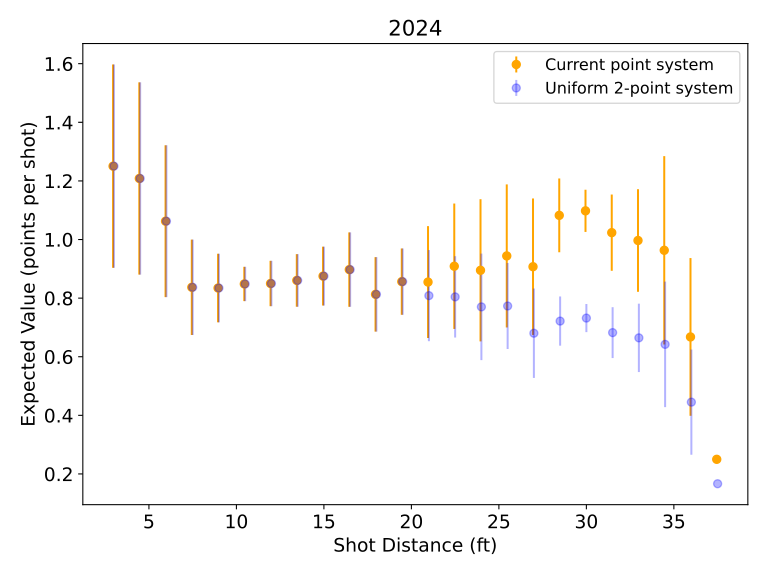
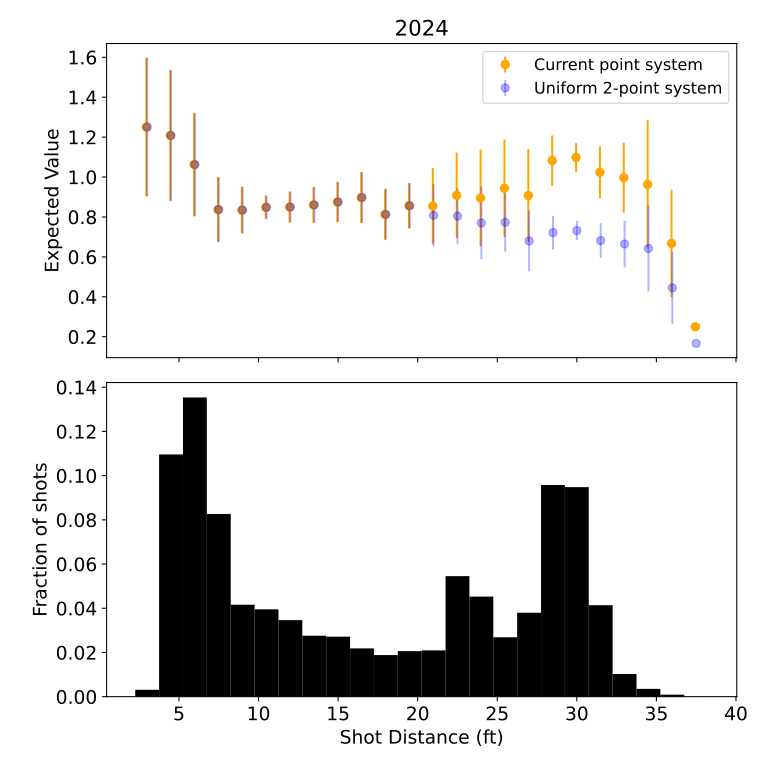
<p>The driving force behind the tri-modal shot distribution is the current point system, which pays a premium for three-point shots in excess of their relative level of difficulty. To simplify the picture, I’ve collapsed expected value within a given distance to the basket. In addition, I’ve plotted what expected value would be in an alternate universe where the three-point line had not been introduced.</p>

<p><img src="/assets/imgs/nba3/expected_value_v_distance_2024.svg" alt="2024 Shot Expected Value vs Distance" /></p>

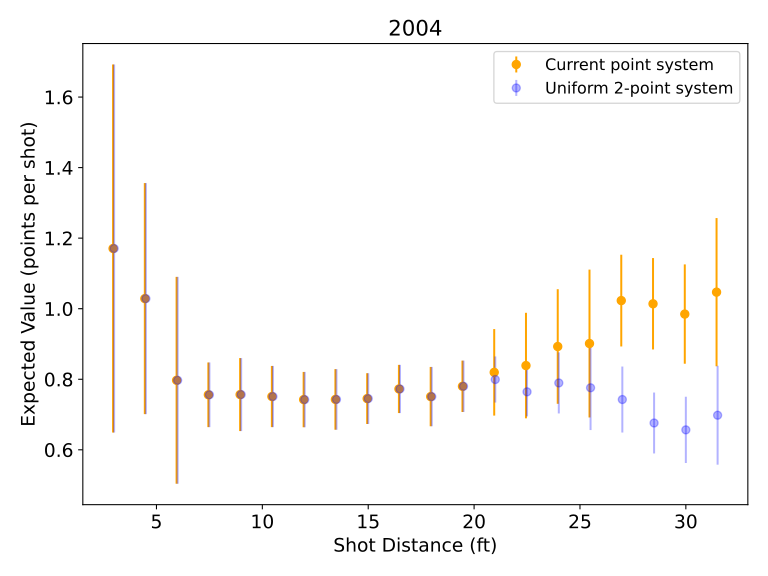
<p>The three-point premium is represented by spaces between orange and blue points. Pick any blue point from the mid-range and eyeball how much higher it is than another blue point from beyond the arc. That difference is likely smaller than the difference between the second blue point and the orange point above it, i.e., the premium given for shooting from beyond 20 feet. The first time I plotted this, I was struck by how the current point system bends the shape of the expected value curve from a decreasing function of distance to a “U”-shaped curve due to the high-expected value plateau around 30 feet. I’ll examine this more closely in a moment.</p>

<p>This excessive premium was available as far back as 2004.</p>

<p><img src="/assets/imgs/nba3/expected_value_v_distance_2004.svg" alt="2004 Shot Expected Value vs Distance" /></p>

<p>In other words, players have long been skilled enough to gain extra points by shooting more threes. What happened in 2010 was a realization, not an evolution of talent.</p>

<h3 id="should-we-do-something"><strong>Should we do something??</strong></h3>

<p>There is ample room for opinion on this question. To me the core tension is between leaving the game to evolve on its own and intervening. On the one hand, shot distribution may become so predictable as to make it an easy target for defensive counter tactics which will break the trend. On the other, there is no guarantee the game always evolves to a better place or continues to evolve at all. Maybe a small crack in the game’s design will grow larger.</p>

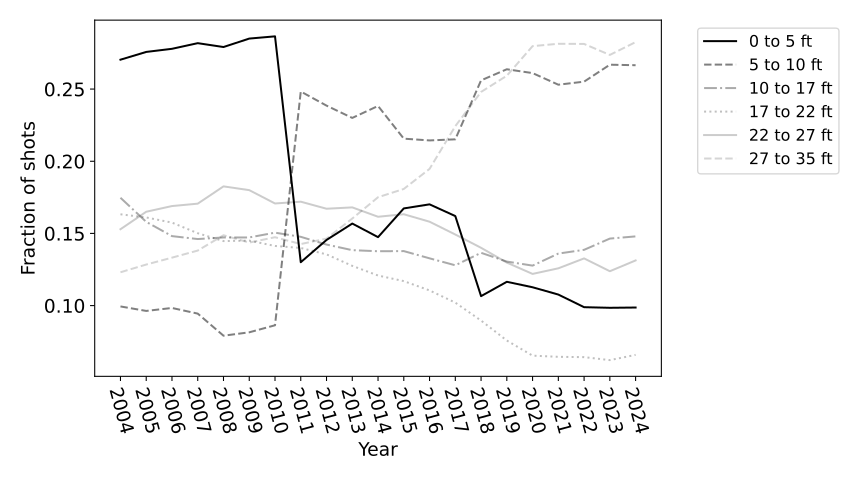
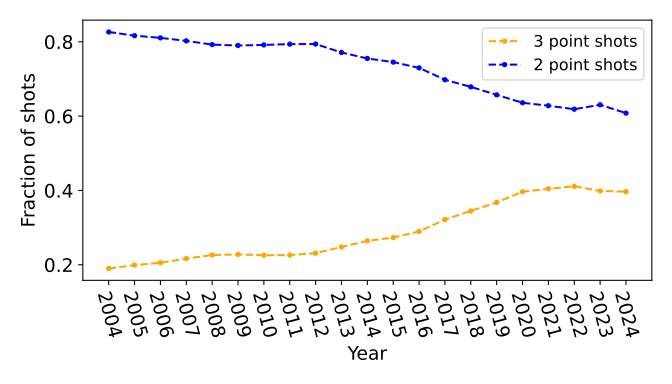
<p>If the game is to evolve, it is reasonable to expect this will play out on a generational timescale. The median NBA career lasts about 5 years<sup id="fnref:13" role="doc-noteref"><a href="#fn:13" class="footnote" rel="footnote">12</a></sup>. Let’s take an NBA-generation as the duration we should hold our breath, less some lead time for discussion and planning of solutions. That would make now a good time to start the process. One can see a leveling out of the shot distribution beginning in 2020.</p>

<p><img src="/assets/imgs/nba3/shot_fraction_historical_trends.svg" alt="Historical Shot Breakdown" /></p>

<p><img src="/assets/imgs/nba3/two_vs_three_point_shot_fraction_historical_trends.svg" alt="2 vs 3 Historical" /></p>

<h3 id="what-should-we-do"><strong>What should we do?</strong></h3>

<p>Above I argued that competition and the desire to win drove us to an overly concentrated shot distribution. However, the ultimate cause of the collapse to predictability was the bluntness of the three-point line itself. The stripe rudely inserts a discontinuity in an otherwise continuous curve of shot difficulty. We don’t have to live with the mistakes of our past. The MLB’s recent rule changes provide a model of success<sup id="fnref:12" role="doc-noteref"><a href="#fn:12" class="footnote" rel="footnote">13</a></sup>. But we should keep in mind the flaws of a previous rule change as we consider a new one. Moreover, we should be deliberate and experimental like the MLB, using the G league as a laboratory.
I’ve heard of two proposed solutions.</p>

<ol>
  <li>Move and / or reshape the current three-point line</li>
  <li>Limit the number of three-point shots a team may take in a game</li>
</ol>

<p>The first solution has been nicely developed by Kirk Goldsberry. Also seen in a WhatsApp chat with my brother. (Note how deftly he sidesteps my ramblings.)</p>

<p><img src="/assets/imgs/nba3/WhatsApp_nba3.png" alt="WhatsApp Chat" /></p>

<p>Bill Simmons has discussed the second solution on his podcast. Please indulge me two more extreme solutions with low to vanishing chance of becoming implemented but which provide some contrast.</p>

<ol type="a">
 <li>Remove the three-point line</li>
 <li>Assign shot values as the inverse of shooting percentage</li>
</ol>

<p>To anchor discussion, here again are the 2024 shot expected value and shot distribution versus distance to the basket.</p>

<p><img src="/assets/imgs/nba3/combo_plot_2024.svg" alt="2024 Combo Plot" /></p>

<p>Our goal is to make rule changes that re-distribute the mass in those giant modes around the court to produce a more diverse, uniform shot distribution. That would correspond to rich, compelling gameplay. All but one of these solutions would achieve this goal via change to the expected value curve.</p>

<p>Solution (a) is the extreme conservative position, which was voiced in dissent of the three-point line’s introduction in 1980<sup id="fnref:6:1" role="doc-noteref"><a href="#fn:6" class="footnote" rel="footnote">6</a></sup>. It leaves expected value to follow the shape of shooting percentage, represented by the blue points. We would expect shot distribution to shift up this curve, in toward the basket, returning to a state which original proponents of the three sought to disrupt.</p>

<p>Solution (b) is the extreme liberal position. It’s fun but better suited for science fiction than reality. It could be implemented by analyzing historical shot data over some period at the start of each season, and then assigning point values to each position on the floor as the inverse of shooting percentage. A more reasonable version might use a moving average to smooth out this value function. But inevitably you’d introduce decimals in the scores. Then teams could really win by a rounding error! The picture of this on the expected value plot would be a perfectly horizontal line at a height of one (or any value you like). This represents the Platonic ideal of what we would like to achieve.
Now for the real solutions.</p>

<p>Solution (1) could see the corner three flared out of existence, or the line moved back, or a combination. Whatever the specific arrangement, the effect on expected value would be to shove some of those orange points down to their blue alternate universe cousins. The main question is how far to take this. Stopping at the corner leaves the majority of threes undistributed. Pushing the stripe back 1-2 feet as my brother suggests also leaves a lot on the table. Astonishingly, the highest point on the expected value curve outside of five feet is around 27 feet. And it is fairly steady up to 35! So to address these shots would require pushing the line by four or more feet. But then, do we really want to cut down on threes so drastically? If your fight is with close threes in particular, solution (1) could work, but it feels a bit blunt.</p>

<p>Finally, solution (2) is the oddball. It doesn’t change the expected value curve, but nonetheless would have the desired result of redistributing shots. It does add a new element to the game, rather than modifying an existing one. Maybe that seems overly complicated. But there is precedent for keeping track of finite resources in-game: timeouts, personal fouls, challenges. Furthermore, it doesn’t single out any specific three-point zone or distance, so in principle it could re-distribute shots from both modes without eliminating them completely. If you really buy into the arguments of this piece, you might reason that given a finite number of threes allowed, players would choose the easiest ones, exacerbating the overemphasis of corner threes. A combo solution of Goldsberry’s flaring out the corner three and Simmons’ three-point cap could be used to address this issue.</p>

<h3 id="conclusion"><strong>Conclusion</strong></h3>

<p>This story contains a lesson about when design and evolution meet. In the excitement of watching a game emerge within the constraints of the rules and features of one’s own design, it borders on impossible not to swell with optimism about all the ways competition will evolve the game to new heights. But as in optimization, specifying the ends does not guarantee that the resulting means will be beautiful. Cracks and hacks are inevitably found, exploited, and used to corrupt the designer’s ethereal intentions. The best games, or markets, processes, systems of any kind, are self-correcting. But how to build that in remains a mystery.</p>

<h3 id="footnotes"><strong>Footnotes</strong></h3>

<div class="footnotes" role="doc-endnotes">
  <ol>
    <li id="fn:1" role="doc-endnote">
      <p><a href="https://www.forbes.com/sites/bradadgate/2025/04/17/for-the-2024-25-nba-regular-season-ratings-declined-by2/">Ratings are down</a> <a href="#fnref:1" class="reversefootnote" role="doc-backlink">&#8617;</a></p>
    </li>
    <li id="fn:2" role="doc-endnote">
      <p><a href="https://www.reddit.com/r/nba/comments/1bcj2es/bill_simmons_nba_officiating_has_changed_post_all/">officiating … without ceremony</a> <a href="#fnref:2" class="reversefootnote" role="doc-backlink">&#8617;</a></p>
    </li>
    <li id="fn:3" role="doc-endnote">
      <p><a href="https://www.theringer.com/2025/04/02/nba/too-many-3s-time-to-move-the-line">Goldsberry The Ringer piece</a> <a href="#fnref:3" class="reversefootnote" role="doc-backlink">&#8617;</a> <a href="#fnref:3:1" class="reversefootnote" role="doc-backlink">&#8617;<sup>2</sup></a></p>
    </li>
    <li id="fn:4" role="doc-endnote">
      <p><a href="https://www.reddit.com/r/nba/comments/7j76f2/the_best_walter_clyde_frazier_phrases/">slicing and dicing</a> <a href="#fnref:4" class="reversefootnote" role="doc-backlink">&#8617;</a></p>
    </li>
    <li id="fn:5" role="doc-endnote">
      <p><a href="https://futurama.fandom.com/wiki/Blernsball">Blernsball </a> <a href="#fnref:5" class="reversefootnote" role="doc-backlink">&#8617;</a></p>
    </li>
    <li id="fn:6" role="doc-endnote">
      <p><a href="https://news.google.com/newspapers?id=ed4hAAAAIBAJ&amp;sjid=Q6EFAAAAIBAJ&amp;pg=4080%2C890763">“NBA Votes 3-Pointer In, 3rd Ref Out.” Reading Eagle, June 22, 1979</a> <a href="#fnref:6" class="reversefootnote" role="doc-backlink">&#8617;</a> <a href="#fnref:6:1" class="reversefootnote" role="doc-backlink">&#8617;<sup>2</sup></a></p>
    </li>
    <li id="fn:7" role="doc-endnote">
      <p>Simmons, Bill. 2009. <em>The Book of Basketball.</em> ESPN Books. p. 139-141. <a href="#fnref:7" class="reversefootnote" role="doc-backlink">&#8617;</a></p>
    </li>
    <li id="fn:8" role="doc-endnote">
      <p><a href="https://www.kaggle.com/datasets/mexwell/nba-shots?resource=download">NBA shot data</a> <a href="#fnref:8" class="reversefootnote" role="doc-backlink">&#8617;</a></p>
    </li>
    <li id="fn:9" role="doc-endnote">
      <p>Each of the hypothetical distributions is Boltzmann distributed, with unit temperature, also referred to as softmax. This form of distribution maximizes entropy given the constraints. Without constraints, this is equivalent to a uniform distribution, as in “Shoot from everywhere”. The “energies” are normalized shooting percentage or normalized expected value in the “Shoot your best shot” and “Shoot your highest value shot” distributions, respectively. <a href="#fnref:9" class="reversefootnote" role="doc-backlink">&#8617;</a></p>
    </li>
    <li id="fn:10" role="doc-endnote">
      <p>The hypothetical and observed shot probability distributions are compared using Kullback-Leibler divergence, also known as relative entropy. <a href="#fnref:10" class="reversefootnote" role="doc-backlink">&#8617;</a></p>
    </li>
    <li id="fn:11" role="doc-endnote">
      <p><a href="https://www.vice.com/en/article/how-the-front-office-analyst-took-over-the-nba/">embracing analytics</a> <a href="#fnref:11" class="reversefootnote" role="doc-backlink">&#8617;</a></p>
    </li>
    <li id="fn:13" role="doc-endnote">
      <p><a href="https://www.nba.com/nuggets/features/junior_bridgeman_20100610.html">median NBA career</a> <a href="#fnref:13" class="reversefootnote" role="doc-backlink">&#8617;</a></p>
    </li>
    <li id="fn:12" role="doc-endnote">
      <p><a href="https://www.ap.org/news-highlights/spotlights/2024/shorter-games-more-running-more-action-two-years-in-mlbs-rule-changes-have-provided-a-jolt/#:~:text=Baseball%20rule%20changes%20having%20tangible%20impact&amp;text=The%20average%20game%20time%20has,Youth%20participation%20is%20spiking.">MLB … model of success</a> <a href="#fnref:12" class="reversefootnote" role="doc-backlink">&#8617;</a></p>
    </li>
  </ol>
</div>]]></content><author><name>Stefan Pate</name></author><category term="blog" /><category term="opinion" /><category term="analysis" /><category term="sports" /><summary type="html"><![CDATA[Introduction]]></summary></entry></feed>