An analysis of three-point shooting in the NBA
Introduction
The NBA finds itself in a complicated moment. Ratings are down1. Overall popularity is up. The season has too many games which younger fans don’t watch, but which are required to feed an endless stream of short vertical clips. Contemporary greats – James, Curry, Durant – have regaled us with performances so excellent and sustained that their names and likenesses have become synonymous with the Association. At the same time they’ve cast their long shadows over the ascendance of bright young stars. Offensive play has reached new heights, so much so that the top brass put their thumbs on the balance of officiating last winter without ceremony2. The Knicks are back baby! After eons of darkness, the beacon once again stands lit above MSG. But how long can a shallow depth chart burn the candle at both ends? Or maybe there are no simple moments in the NBA. Maybe the game and how it entertains keep changing as we nervously cling to last year’s edition. …or for Knick fans, cling to mediocrity since there is no hurt more painful than that preceded by hope.
The meteoric rise of three-point shooting volume in the past several years has been yet another source of consternation among fans, media, and former players. A striking heatmap of shots posted by Kirk Goldsberry displays this clearly3. But the spirit of the critique is best embodied by a minute-long clip of the Boston Celtics and Toronto Raptors assiduously building a house of the Big Bad Wolf’s nightmares.
BrickCenter (@BrickCenter_) https://x.com/i/status/1874191493998706910
— BrickCenter (@BrickCenter_)
Although the video misrepresents the vast skill of NBA players, it portrays well the monotony that results from an overemphasis of the three-point shot. Sports entertain most when gameplay is neither predictable nor predictably unpredictable. A faceoff between great opponents happens on a knife’s edge. No strike is landed without a counter, and constant counters plunge the competition deeper into the well of creativity. In my own circles, images of Jordan slicing and dicing4 through the midrange are often conjured in juxtaposition to the contemporary long-range catch-and-shoot aesthetic. But winning, not aesthetics is the primary objective of sports, making the unintended elegance more precious. We should not bemoan winning strategies that are metronomic. A repeat championship in Boston seemed inevitable before a tragic end of season, brick houses notwithstanding. And we should take care not to suffocate the game with incremental rule changes lest we drift towards Blernsball5. Intervention should proceed deliberately, experimentally, and only if the natural evolution and diversity of gameplay seem stagnant under the existing rules. After all, the three-point line now on trial was originally introduced to “add excitement to the game”6, was subsequently ignored for the better part of a decade7, and in no way stymied the mid-range greatness of 90s and 00s players like Jordan and Kobe. The reality is that a big change has occurred in the past decade and a half. It jumps out from the data. The change happened swiftly, suggesting it was memetic, and is consistent with a simple explanation that players and teams want to win. The distribution of shots now appears to be past this transition. It’s been steady for about the median length of an NBA career. Now is the time to start discussing the issue and planning possible solutions. I’ll provide an opinion on a couple solutions which have been passed around.
Shot distribution is bi-tri-modal
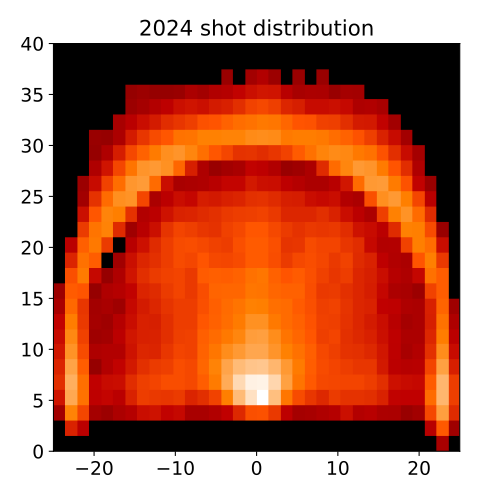
If our hearts don’t deceive us as fans, we should see evidence of change in the shot distribution data8. It should appear as a bimodal distribution of shots – hot spots near the basket and behind the three-point line, and relatively fewer shots in the mid-range between. Such a pattern is clear in a two-dimensional histogram of shots taken over the 2024 season. Hotter colors indicate higher density.
But look at the picture when we sum together all shots taken at a given distance from the basket. We see a third mode appear.
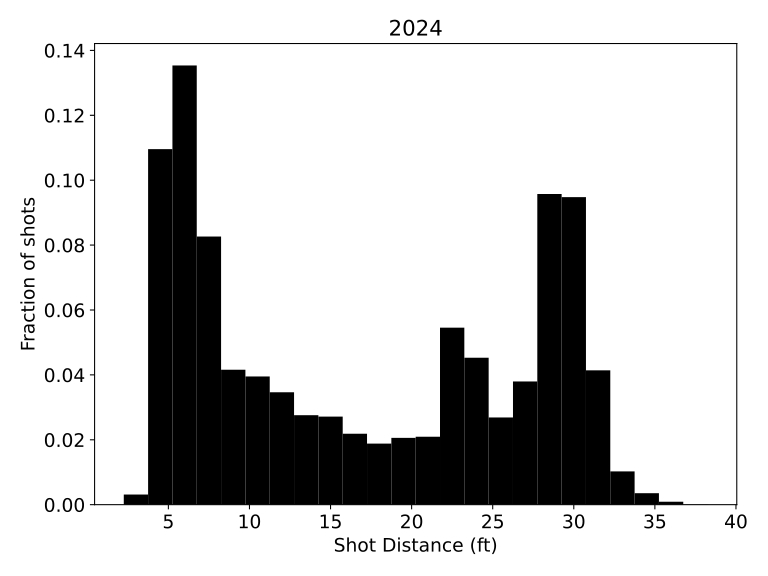
This middle mode, sitting just beyond 20 feet from the basket, corresponds to the corner three. This quirky solution to a lack of width in the NBA court provides a relatively easy opportunity to score three points. Eliminating this shot is the primary solution prescribed by Kirk Goldsberry in his The Ringer piece3. The corner three draws extra criticism for being too easy a way to score three points. However, eliminating the corner three does not completely address the issue. Notice the towering mode straddling the 30 foot mark[#]. Our goal to encourage a variety of scoring strategies distributed all over the court corresponds in the histogram to deflating those giant peaks, taking their mass and spreading them out in a more uniform manner.
The shot distribution in 2004 was more consistent with this picture.
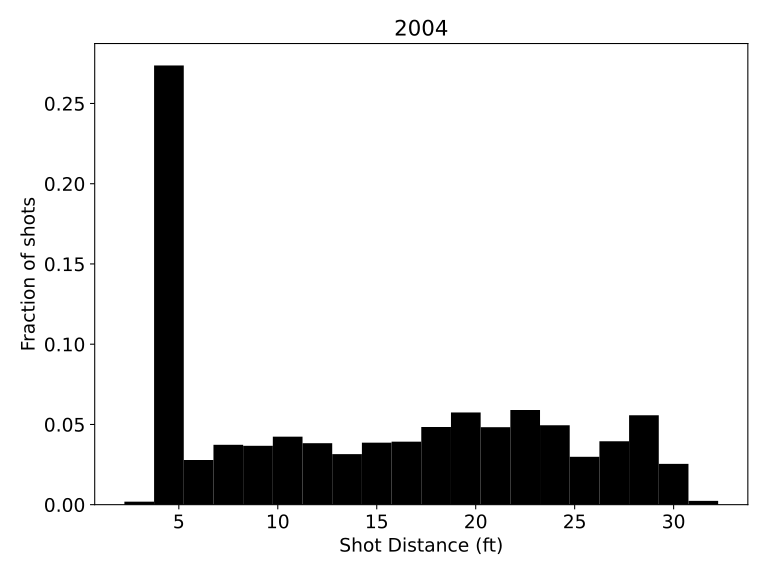
I don’t claim that 2004 was an apogee of competition or entertainment, only that the shot distribution was more uniformly spread across the floor. In fact, it was competition that drove the evolution toward a tri-modal shot distribution over the ensuing two decades.
Players distribute their shots tri-modally because it’s a winning strategy
This point may seem too obvious to make. Of course, all things equal, it’s better to score three points than two. But whether it pays to shoot the volume of three-point shots, distributed over the floor in the particular way we’ve seen, depends also on shooting percentage. The right metric to look at is expected value, the number of points expected per shot on average. When overlaid on the half-court, the picture bears a striking resemblance to shot distribution. Both exhibit hot spots near the basket and beyond the arc, with milder red colors in between.
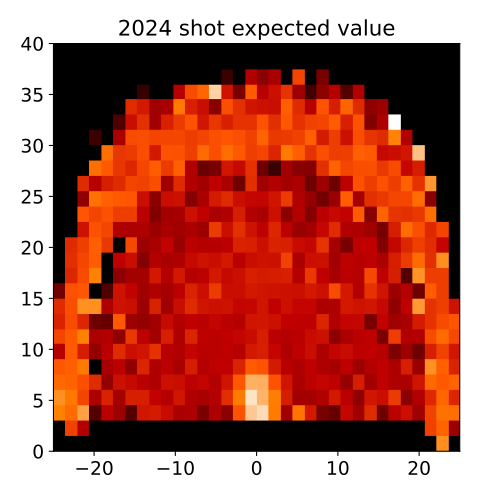
But can we say definitively from this that the 2024 shot distribution is a winning strategy? We’ve only squinted at the two pictures and anyway they are plotted in different units. Shot distribution is counted in fractions of the total shots taken. Expected value is measured in points.
To test my claim that shooting has moved toward a winning strategy, I’ve assumed that the fractions of shots taken over the course of a season are like probabilities and asked which of three hypothetical probability distributions best recapitulates the one we observed. The simplest hypothesis, “Shoot from everywhere”, says that a lot of things are going on in a basketball game: the offense dribbles and moves the ball to get a good shot, the defense works to deny them, coaches draw up schemes. In the end, it all cancels out, and shots go up from all over the court. The second hypothesis, “Shoot your best shot”, also assumes this chaos, but adds in that offensive players tend to take shots they are likely to make. The final hypothesis, “Shoot your highest value shot”, asserts that players don’t just shoot to make. They shoot to earn as many points as possible. Have a look at the shot distributions these three hypotheses predict9.
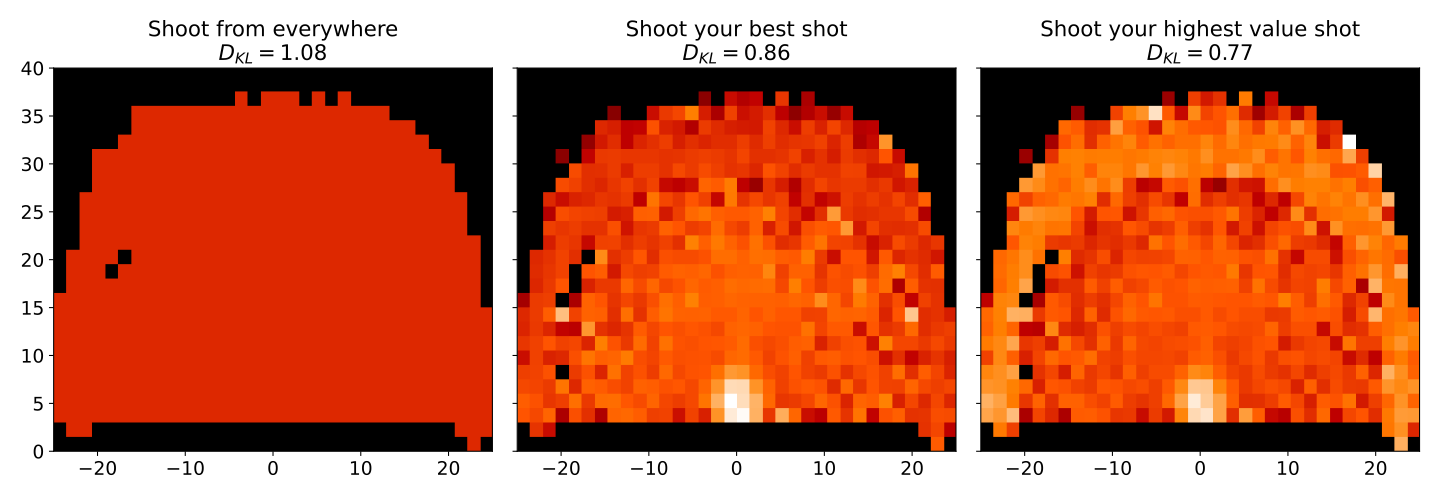
“Shoot from everywhere” admittedly is a straw man but serves as a helpful point of reference. Both “Shoot your best shot” and “Shoot your highest value shot” get the hotspot around the basket right, but the latter better captures the three-point hotspot. Now that both hypothesis and ground truth are expressed in the same units of probability, there is a way to measure how far off they are10. By this measure, “Shoot your highest value shot” is most consistent with the true 2024 shot distribution.
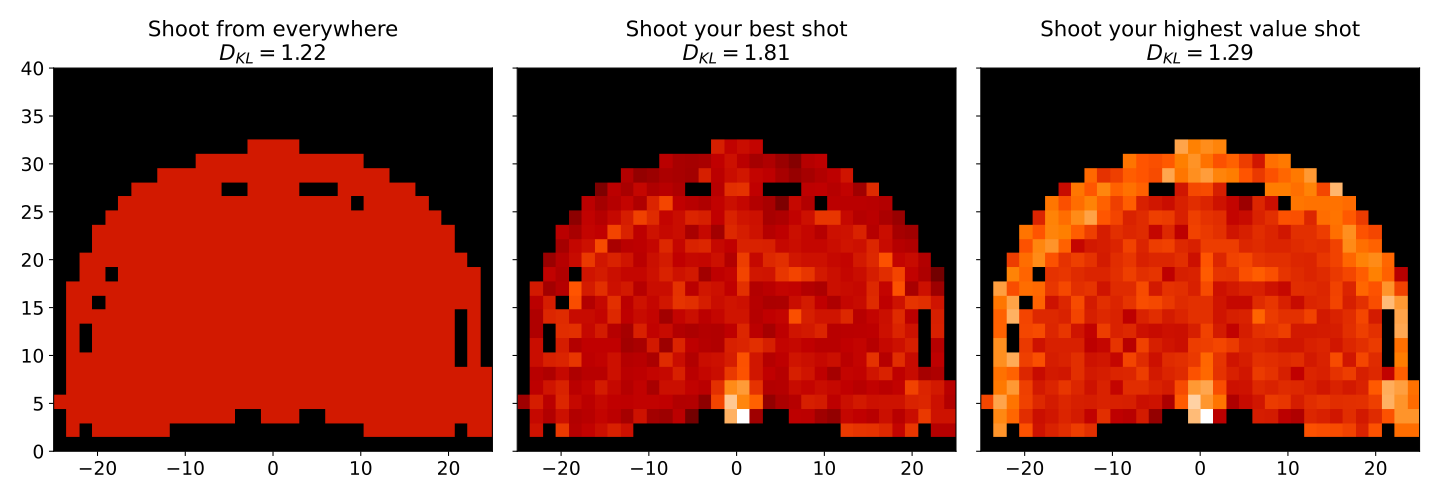
But this was not always the case. In 2004, the straw man “Shoot from everywhere” was a slightly better approximation of the true shot distribution than “Shoot your highest value shot”.
The 2010s saw the value-optimizing strategy come to the fore, distancing itself from the other two hypotheses.
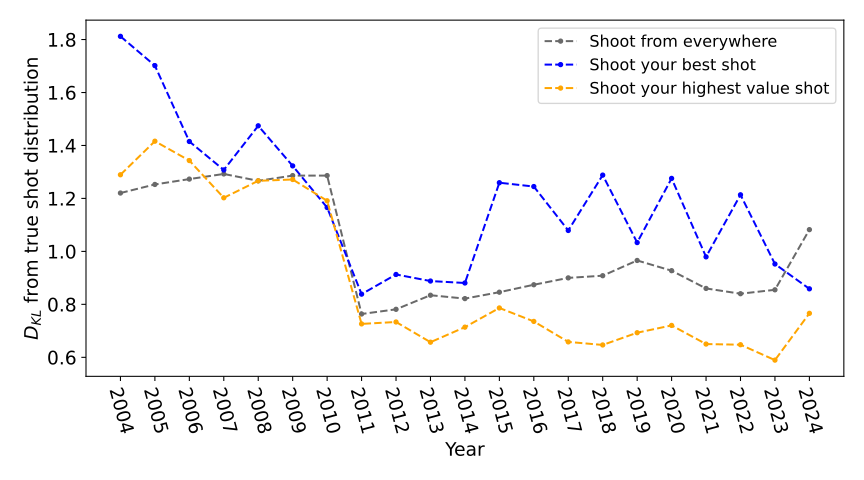
This is conspicuous timing. At this time, NBA teams began embracing analytics11. Analytics may have been the catalyst, but the potential for change was already present.
The winning strategy lay in wait
The driving force behind the tri-modal shot distribution is the current point system, which pays a premium for three-point shots in excess of their relative level of difficulty. To simplify the picture, I’ve collapsed expected value within a given distance to the basket. In addition, I’ve plotted what expected value would be in an alternate universe where the three-point line had not been introduced.
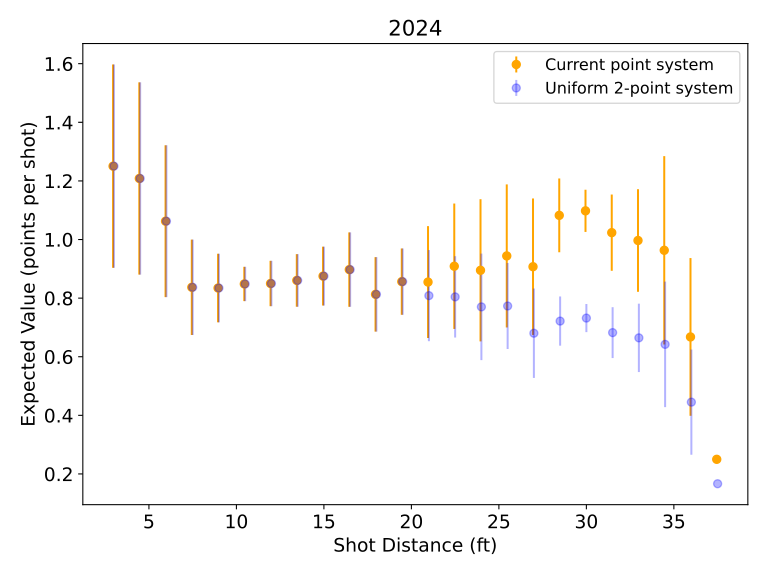
The three-point premium is represented by spaces between orange and blue points. Pick any blue point from the mid-range and eyeball how much higher it is than another blue point from beyond the arc. That difference is likely smaller than the difference between the second blue point and the orange point above it, i.e., the premium given for shooting from beyond 20 feet. The first time I plotted this, I was struck by how the current point system bends the shape of the expected value curve from a decreasing function of distance to a “U”-shaped curve due to the high-expected value plateau around 30 feet. I’ll examine this more closely in a moment.
This excessive premium was available as far back as 2004.
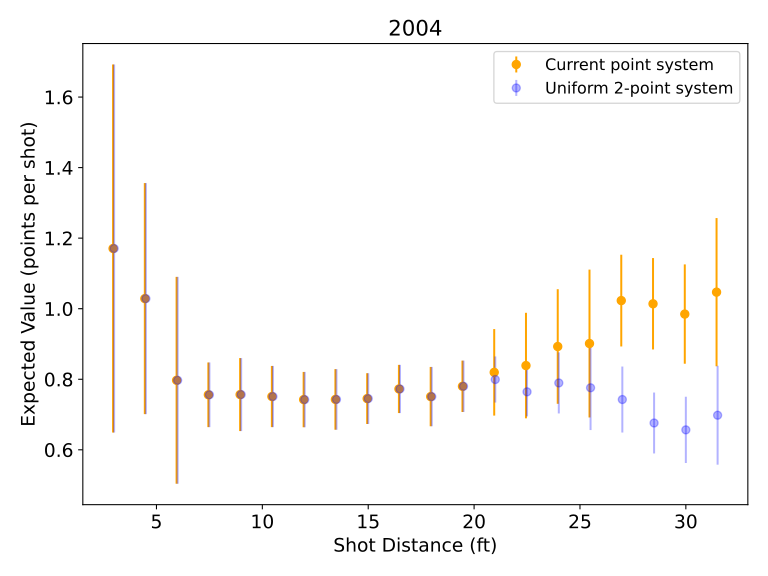
In other words, players have long been skilled enough to gain extra points by shooting more threes. What happened in 2010 was a realization, not an evolution of talent.
Should we do something??
There is ample room for opinion on this question. To me the core tension is between leaving the game to evolve on its own and intervening. On the one hand, shot distribution may become so predictable as to make it an easy target for defensive counter tactics which will break the trend. On the other, there is no guarantee the game always evolves to a better place or continues to evolve at all. Maybe a small crack in the game’s design will grow larger.
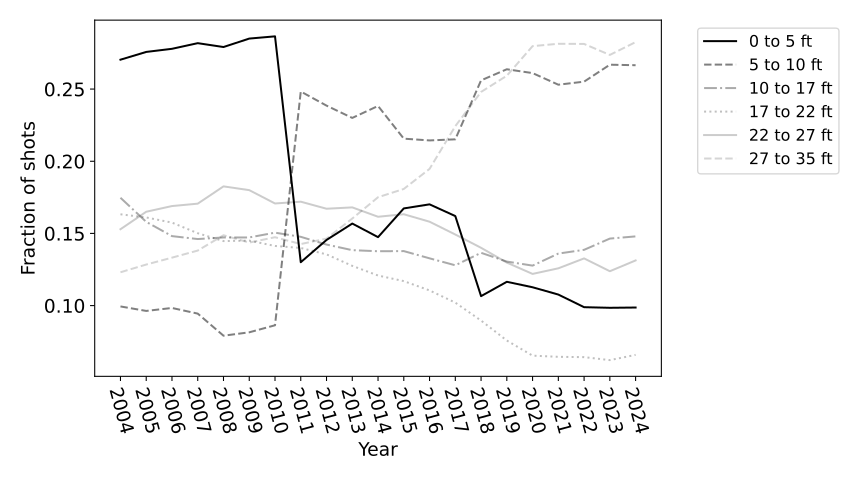
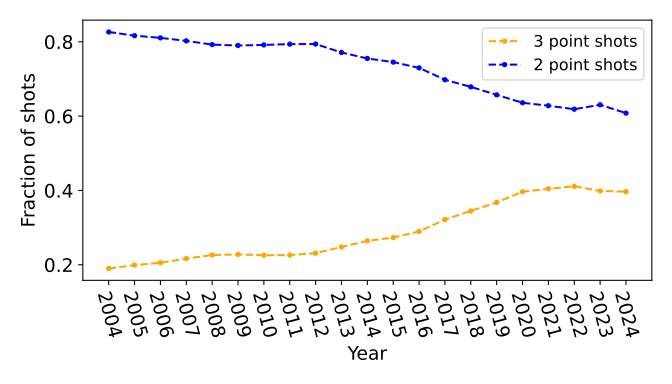
If the game is to evolve, it is reasonable to expect this will play out on a generational timescale. The median NBA career lasts about 5 years12. Let’s take an NBA-generation as the duration we should hold our breath, less some lead time for discussion and planning of solutions. That would make now a good time to start the process. One can see a leveling out of the shot distribution beginning in 2020.
What should we do?
Above I argued that competition and the desire to win drove us to an overly concentrated shot distribution. However, the ultimate cause of the collapse to predictability was the bluntness of the three-point line itself. The stripe rudely inserts a discontinuity in an otherwise continuous curve of shot difficulty. We don’t have to live with the mistakes of our past. The MLB’s recent rule changes provide a model of success13. But we should keep in mind the flaws of a previous rule change as we consider a new one. Moreover, we should be deliberate and experimental like the MLB, using the G league as a laboratory. I’ve heard of two proposed solutions.
- Move and / or reshape the current three-point line
- Limit the number of three-point shots a team may take in a game
The first solution has been nicely developed by Kirk Goldsberry. Also seen in a WhatsApp chat with my brother. (Note how deftly he sidesteps my ramblings.)
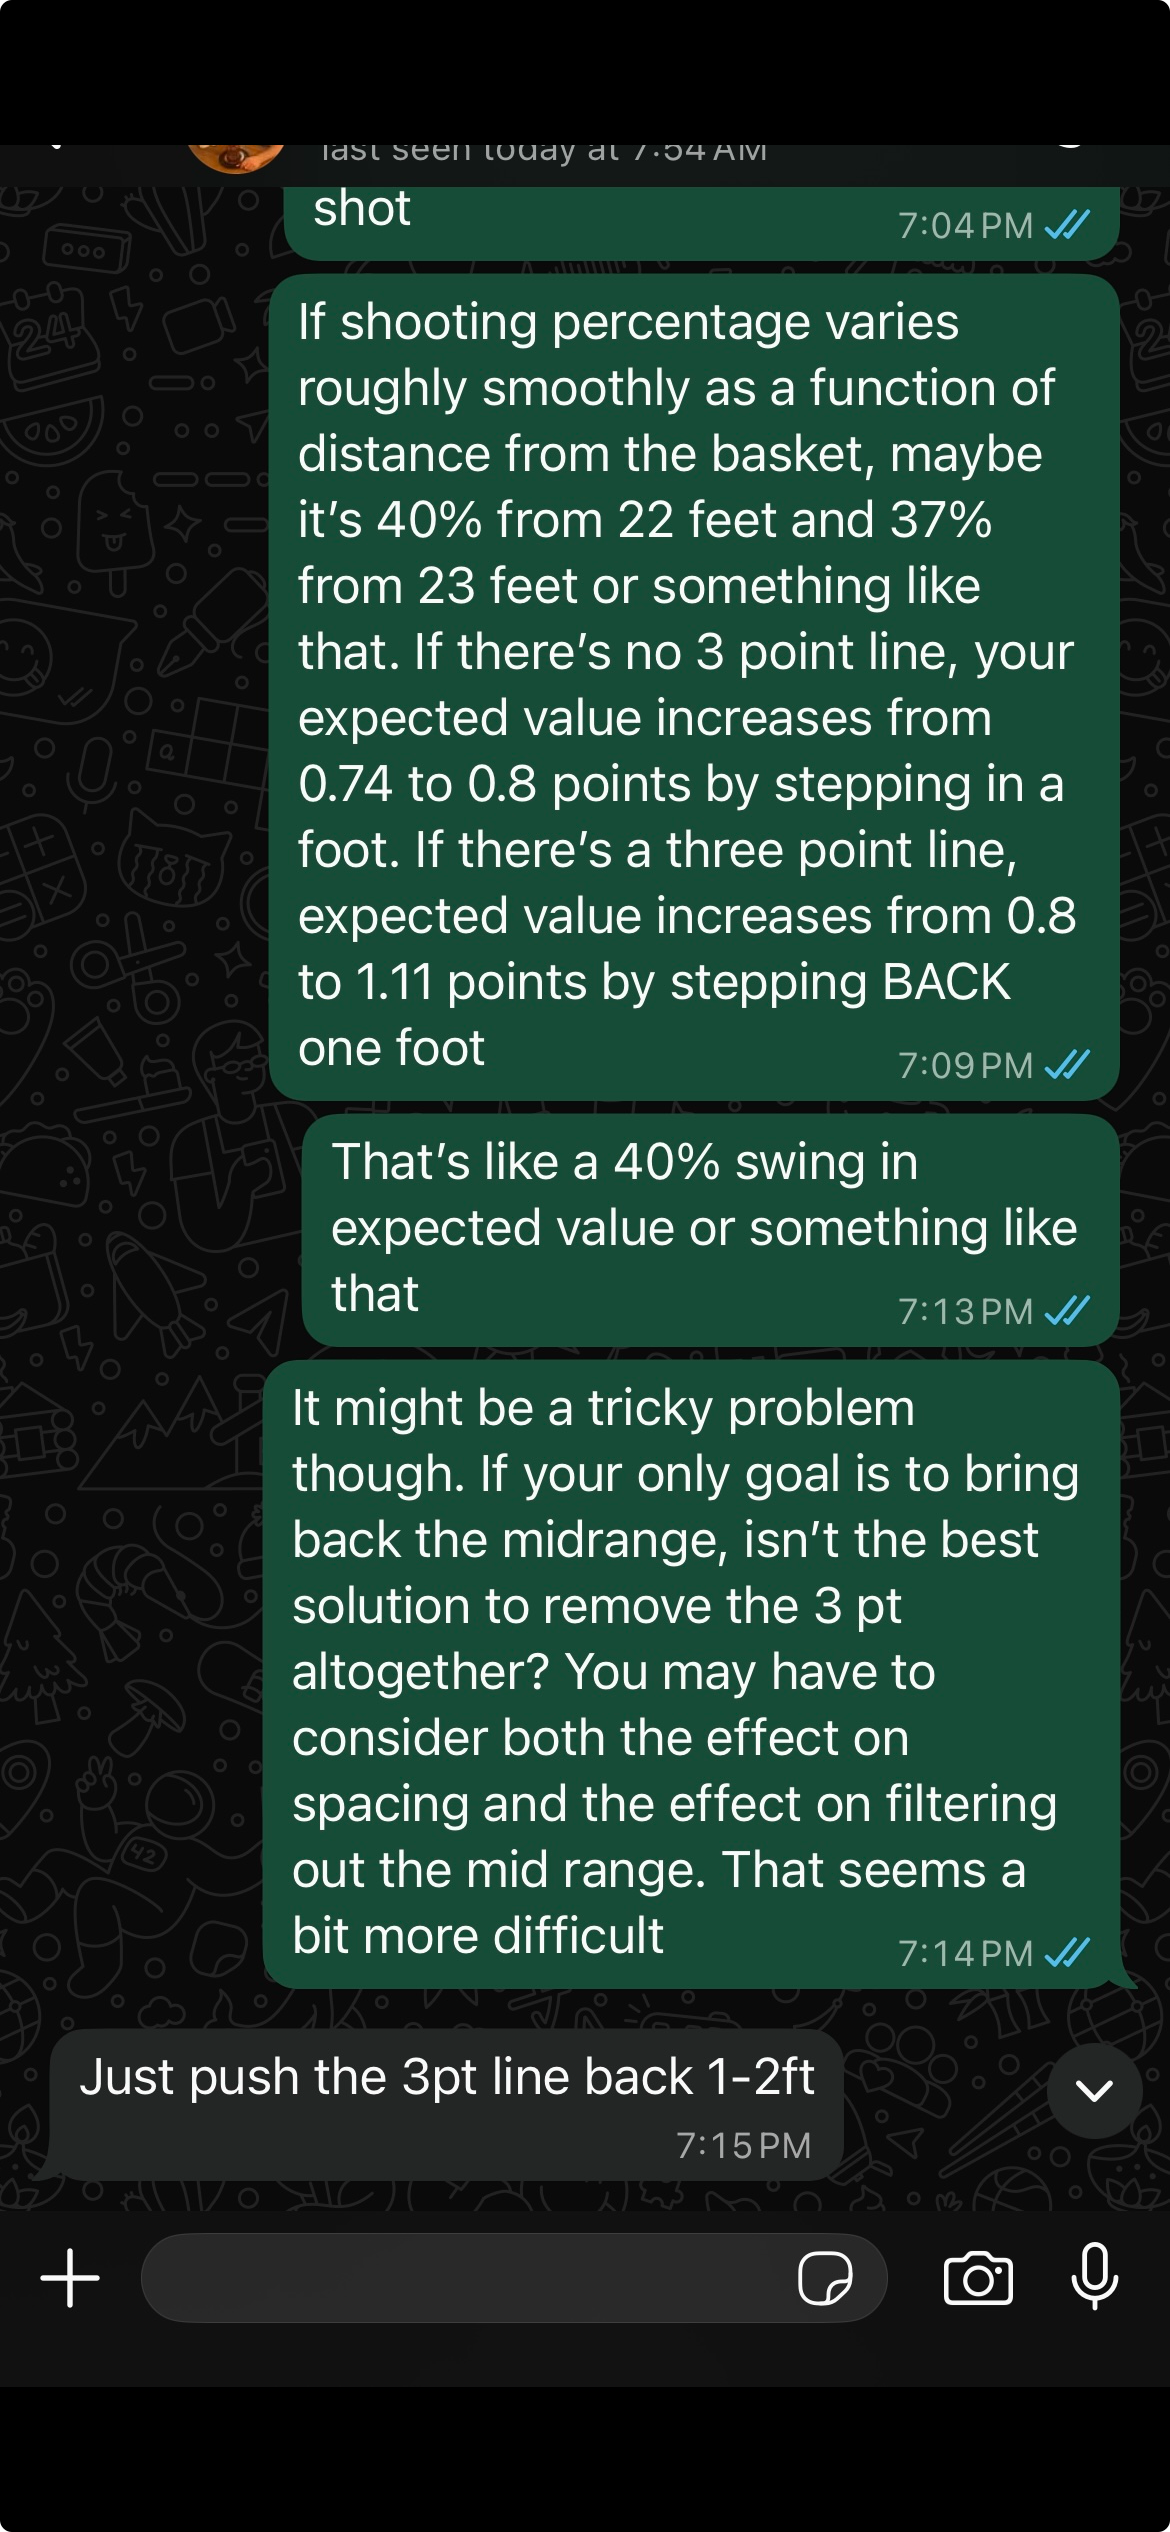
Bill Simmons has discussed the second solution on his podcast. Please indulge me two more extreme solutions with low to vanishing chance of becoming implemented but which provide some contrast.
- Remove the three-point line
- Assign shot values as the inverse of shooting percentage
To anchor discussion, here again are the 2024 shot expected value and shot distribution versus distance to the basket.
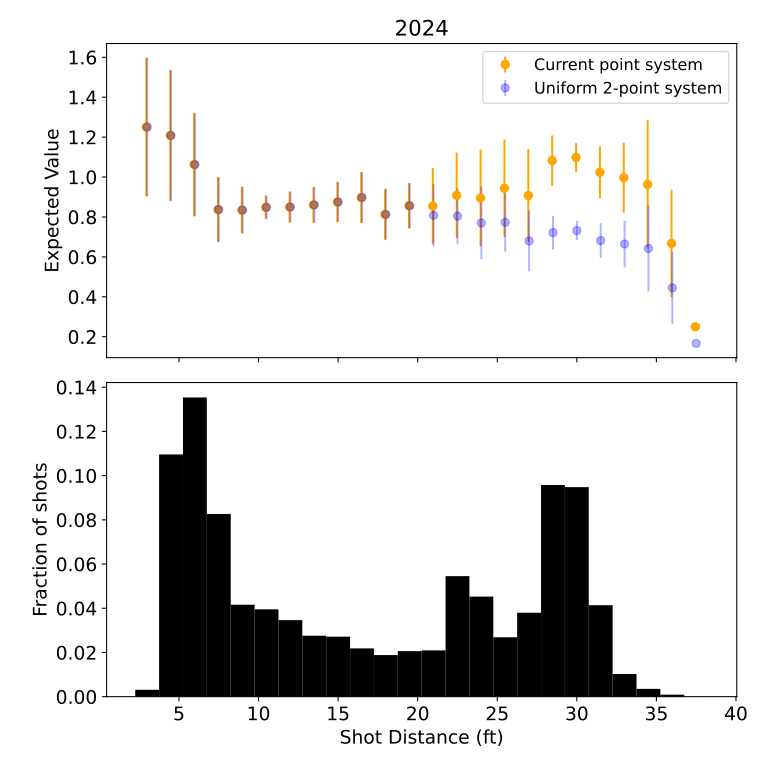
Our goal is to make rule changes that re-distribute the mass in those giant modes around the court to produce a more diverse, uniform shot distribution. That would correspond to rich, compelling gameplay. All but one of these solutions would achieve this goal via change to the expected value curve.
Solution (a) is the extreme conservative position, which was voiced in dissent of the three-point line’s introduction in 19806. It leaves expected value to follow the shape of shooting percentage, represented by the blue points. We would expect shot distribution to shift up this curve, in toward the basket, returning to a state which original proponents of the three sought to disrupt.
Solution (b) is the extreme liberal position. It’s fun but better suited for science fiction than reality. It could be implemented by analyzing historical shot data over some period at the start of each season, and then assigning point values to each position on the floor as the inverse of shooting percentage. A more reasonable version might use a moving average to smooth out this value function. But inevitably you’d introduce decimals in the scores. Then teams could really win by a rounding error! The picture of this on the expected value plot would be a perfectly horizontal line at a height of one (or any value you like). This represents the Platonic ideal of what we would like to achieve. Now for the real solutions.
Solution (1) could see the corner three flared out of existence, or the line moved back, or a combination. Whatever the specific arrangement, the effect on expected value would be to shove some of those orange points down to their blue alternate universe cousins. The main question is how far to take this. Stopping at the corner leaves the majority of threes undistributed. Pushing the stripe back 1-2 feet as my brother suggests also leaves a lot on the table. Astonishingly, the highest point on the expected value curve outside of five feet is around 27 feet. And it is fairly steady up to 35! So to address these shots would require pushing the line by four or more feet. But then, do we really want to cut down on threes so drastically? If your fight is with close threes in particular, solution (1) could work, but it feels a bit blunt.
Finally, solution (2) is the oddball. It doesn’t change the expected value curve, but nonetheless would have the desired result of redistributing shots. It does add a new element to the game, rather than modifying an existing one. Maybe that seems overly complicated. But there is precedent for keeping track of finite resources in-game: timeouts, personal fouls, challenges. Furthermore, it doesn’t single out any specific three-point zone or distance, so in principle it could re-distribute shots from both modes without eliminating them completely. If you really buy into the arguments of this piece, you might reason that given a finite number of threes allowed, players would choose the easiest ones, exacerbating the overemphasis of corner threes. A combo solution of Goldsberry’s flaring out the corner three and Simmons’ three-point cap could be used to address this issue.
Conclusion
This story contains a lesson about when design and evolution meet. In the excitement of watching a game emerge within the constraints of the rules and features of one’s own design, it borders on impossible not to swell with optimism about all the ways competition will evolve the game to new heights. But as in optimization, specifying the ends does not guarantee that the resulting means will be beautiful. Cracks and hacks are inevitably found, exploited, and used to corrupt the designer’s ethereal intentions. The best games, or markets, processes, systems of any kind, are self-correcting. But how to build that in remains a mystery.
Footnotes
-
“NBA Votes 3-Pointer In, 3rd Ref Out.” Reading Eagle, June 22, 1979 ↩ ↩2
-
Simmons, Bill. 2009. The Book of Basketball. ESPN Books. p. 139-141. ↩
-
Each of the hypothetical distributions is Boltzmann distributed, with unit temperature, also referred to as softmax. This form of distribution maximizes entropy given the constraints. Without constraints, this is equivalent to a uniform distribution, as in “Shoot from everywhere”. The “energies” are normalized shooting percentage or normalized expected value in the “Shoot your best shot” and “Shoot your highest value shot” distributions, respectively. ↩
-
The hypothetical and observed shot probability distributions are compared using Kullback-Leibler divergence, also known as relative entropy. ↩